|
Table A Year-on-Year Growth Rates for Production Index, Net Sales Index and Producer Price Index: January 2014 and December 2013 |
||
|---|---|---|
|
TOTAL MANUFACTURING |
JANUARY
2014
|
DECEMBER
2013
|
|
YEAR-ON-YEAR GROWTH |
|
|
|
Production Index (2000=100) |
|
|
|
Value (VaPI) |
7.3 |
20.2 |
|
Volume (VoPI) |
7.2 |
25.2r |
|
Net Sales Index (2000=100) |
|
|
|
Value (VaNSI) |
17.6 |
33.4r |
|
Volume (VoNSI) |
17.6 |
38.9r |
|
Producer Price Index (2000=100) |
0.1r |
-4.0r |
r - revised
- Value of Production Index shows a single-digit growth in January 2014
Value of Production Index (VaPI) for the manufacturing reflected a slower annual increment of 7.3 percent in January 2014, after registering a two-digit growth in the last five months of 2013, according to the preliminary results of the Monthly Integrated Survey of Selected Industries (MISSI). This can be mainly attributed to the lower production values reported by chemical products with an increase of only 15.5 percent in January 2014 from 218.5 percent in December 2013. In addition, other major industries that were able to pull up the VAPI by registering significant increases in production were the following: furniture and fixtures (115.0%), tobacco products (68.5%), publishing and printing (52.1%), machinery except electrical (47.5%), textiles (31.0%), leather products (22.2%), fabricated metal products (20.3%), electrical machinery (18.1%),non-metallic mineral products (14.8%), petroleum products (12.0%), and rubber and plastic products (10.1%). Refer to Tables 1-A and 1.
On a monthly basis, VaPI dropped 18.9 percent in January 2014. This was brought about by the double-digit decreases in production values of chemical products (-68.2%), tobacco products (-51.8%), and footwear and wearing apparel (-39.2%). Refer to Tables 1-A and 1.
- Volume of Production Index posts slower growth
Volume of Production Index (VoPI) increased slowly to 7.2 percent in January 2014, after posting two-digit growths for the past six months. Fifteen major industries contributed to the single-digit performance of VoPI, led by furniture and fixtures (237.4%). Two-digit increments were noted in the following major industries namely: tobacco products (68.9%), publishing and printing (52.1%), machinery except electrical (44.5%), textiles (31.5%), fabricated metal products (23.8%), leather products (21.0%), chemical products (15.8%),), electrical machinery (13.1%) and non-metallic mineral products (11.2%). Refer to Tables 1-B and 2.
On a monthly comparison, VoPI went down 19.4 percent in January 2014. Sixteen of the 20 major sectors pulled down the monthly VOPI with three major industries contributing significantly to the decline, namely: chemical products (-67.8%), tobacco products (-51.7%), and footwear and wearing apparel (-40.8%). Refer to Tables 1-B and 2.
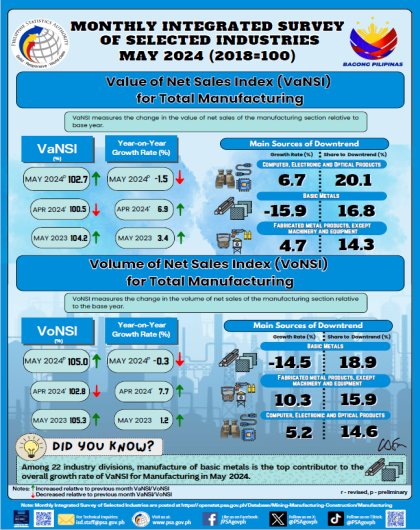
- Value of Net Sales Index keeps two-digit growth in January 2014
Value of Net Sales Index (VaNSI), on an annual basis, eased down to 17.6 percent in January 2014. This was mainly due to the slowdown in net sales value of chemical products (111.7%). Furthermore, double-digit increases were noted in nine major industries. These were the following: machinery except electrical (50.3%), furniture and fixtures (37.0%), leather products (32.9%), fabricated metal products (30.4%), publishing and printing (20.7%), rubber and plastic products (17.0%), petroleum products (16.5%), tobacco products (15.8%) and miscellaneous manufactures (12.7%). Refer to Tables 2-A and 3.
VaNSI on a month-on-month basis, went down 22.0 percent in January 2014. Significant decreases were posted by four major industries namely: chemical products (-57.2%), footwear and wearing apparel (-36.8%), leather products (-12.5%) and non-metallic mineral products (-10.3%). Refer to Tables 2-A and 3.
- Volume of Net Sales Index maintains two-digit growth
Volume of Net Sales Index (VoNSI) grew at a slower rate of 17.6 percent in January 2014. This can be attributed to the slowdown in the annual growth in sales of furniture and fixtures (115.0%) and chemical products (112.1%). Six other industries posted double-digit increments. These were: machinery except electrical (47.2%), fabricated metals (34.1%), leather products (31.7%), publishing and printing (20.7%), tobacco products (16.1%) and rubber and plastic products (16.0%). Refer to Tables 2-B and 4.
However, on a month-on-month basis, VoNSI declined 22.4 percent in January 2014. This was brought about by the significant decrements in VoNSI of four major industries: chemical products (-56.7%), footwear and wearing apparel (-38.5%), leather products (-12.6%) and non-metallic mineral products (-11.1%). Refer to Tables 2-B and 4.
- Capacity Utilization in January 2014 is 83.2 percent
Average capacity utilization in January 2014 for total manufacturing was recorded at 83.2 percent. More than 50 percent or eleven of the 20 major industries operated at 80 percent and above capacity utilization rates. These are:
-
petroleum products (88.8%)
-
basic metals (87.1%)
-
non-metallic mineral products (86.0%)
-
food manufacturing (84.5 %)
-
machinery except electrical (84.2%)
-
electrical machinery (84.4%)
-
chemical products (83.1%)
-
rubber and plastic products (82.7%)
-
paper and paper products (82.7%)
-
wood and wood products (81.1%)
-
publishing and printing (80.0%)
The proportion of establishments that operated at full capacity (90% to 100%) was 22.4 percent in January 2014. About 57.6 percent of the establishments operated at 70% to 89% capacity while 20.0 percent of the establishments operated below 70% capacity. Refer to Table 6.
|
Table B Distribution of Key Manufacturing Establishments by Capacity Utilization for Total Manufacturing: January 2014 |
|
|---|---|
|
Capacity Utilization
|
Percent Share |
|
Below 50% |
4.0 |
|
50% - 59% |
4.7 |
|
60% - 69% |
11.3 |
|
70% - 79% |
23.6 |
|
80% - 89% |
34.0 |
|
90% - 100% |
22.4 |
- Industry Coverage
The 2014 MISSI utilizes the 2009 Philippine Standard Industry Classification (PSIC) to classify major industries and sub-industries. Twenty major industries of the 2009 PSIC were grouped to form the industry coverage of the 2014 MISSI. These are presented in the table below.
|
2009 PSIC CODE |
INDUSTRY DESCRIPTION |
|---|---|
|
C10 |
Food manufacturing * |
|
C11 |
Beverages |
|
C12 |
Tobacco products |
|
C13 |
Textiles* |
|
C14, C152 |
Footwear and wearing apparel |
|
C151 |
Leather products |
|
C16 |
Wood and wood products* |
|
C17 |
Paper and paper products |
|
C18, J581 |
Publishing and printing |
|
C19 |
Petroleum products* |
|
C20,C21 |
Chemical products* |
|
C22 |
Rubber and plastic products* |
|
C23 |
Non-metallic mineral products* |
|
C24 |
Basic metals* |
|
C25,C3311 |
Fabricated metal products |
|
C262,C275,C28, C263,C268,C3312,C332 |
Machinery except electrical* |
|
C261,C264,C27, C29301,C3314,C3319 |
Electrical machinery* |
|
C29 except C29301, C30,C3315 |
Transport equipment |
|
C31 |
Furniture and fixtures |
|
C265,C266,C267,C32, C3313 |
Miscellaneous manufactures |
|
Note: * - Major industries categorized into sub-industries |
|
- Response Rate
The response rates for the January 2014 MISSI and PPS are 78.1 percent and 86.0 percent, respectively. Refer to Tables 7 and 8.
|
Table C Response Rates For Total Manufacturing (In percent) |
||
|---|---|---|
|
|
January 2014 |
December 2013 (Revised) |
|
MISSI |
78.1 |
90.5r |
|
PPS |
86.0 |
90.3r |
Data of non-responding samples were estimated based on previous records and other administrative reports of these establishments. Revisions to the preliminary estimates are done upon receipt of actual reports of late respondents.
(Sgd) CARMELITA N. ERICTA
Interim National Statistician
TABLE 1-A Value of Production Index, December 2013– January 2014
(2000 =100)
|
Gainers |
Year-on-Year Growth (%) |
|
|---|---|---|
| January 2014 |
December 2013
(revised)
|
|
|
Furniture and fixtures |
115.0 |
85.6 |
|
Tobacco products |
68.5 |
33.9 |
|
Publishing and printing |
52.1 |
16.1 |
|
Machinery except electrical |
47.5 |
43.9 |
|
Textiles |
31.0 |
-12.1 |
|
Leather products |
22.2 |
50.4 |
|
Fabricated metal products |
20.3 |
15.0 |
|
Electrical machinery |
18.1 |
19.4 |
|
Chemical products |
15.5 |
218.5 |
|
Non-metallic mineral products |
14.8 |
6.2 |
|
Petroleum products |
12.0 |
4.1 |
|
Rubber and plastic products |
10.1 |
14.0 |
|
Wood and wood products |
8.1 |
9.8 |
|
Food manufacturing |
5.0 |
-7.5 |
|
Transport equipment |
0.7 |
29.3 |
|
Losers |
Year-on-Year Growth (%) |
|
|---|---|---|
| January 2014 |
December 2013
(revised)
|
|
|
Basic metals |
-29.6 |
-27.4 |
|
Footwear and wearing apparel |
-23.1 |
-28.3 |
|
Paper and paper products |
-7.3 |
-11.7 |
|
Miscellaneous manufactures |
-3.5 |
-36.3 |
|
Beverages |
-0.1 |
-0.4 |
TABLE 1-A Value of Production Index, December 2013 – January 2014
(2000 = 100) (concluded)
|
Gainers |
Month-on-Month Growth (%) |
|
|---|---|---|
| January 2014 |
December 2013
(revised)
|
|
|
Miscellaneous manufactures |
22.4 |
-16.2 |
|
Publishing and printing |
17.6 |
-13.2 |
|
Transport equipment |
2.6 |
-11.7 |
|
Fabricated metal products |
2.8 |
3.2 |
|
Losers |
Month-on-Month Growth (%) |
|
|---|---|---|
| January 2013 |
December 2013
(revised)
|
|
|
Chemical products |
-68.2 |
6.5 |
|
Footwear and wearing apparel |
-39.2 |
31.3 |
|
Tobacco products |
-51.8 |
0.4 |
|
Petroleum products |
-7.1 |
43.8 |
|
Machinery except electrical |
-4.2 |
-3.7 |
|
Electrical machinery |
-0.7 |
-1.6 |
|
Beverages |
-2.5 |
13.7 |
|
Non-metallic mineral products |
-3.9 |
-0.8 |
|
Food manufacturing |
-0.6 |
-1.8 |
|
Paper and paper products |
-4.7 |
-3.7 |
|
Basic metals |
-1.6 |
-8.8 |
|
Furniture and fixtures |
-6.9 |
12.2 |
|
Rubber and plastic products |
-1.4 |
-4.4 |
|
Textiles |
-1.5 |
10.0 |
|
Leather products |
-7.3 |
8.0 |
|
Wood and wood products |
-2.3 |
-15.9 |
Notes: Major Industries are ranked according to their contribution to the overall 2000-based January 2014 growth rate.
Year-on-year growth rates are computed by dividing the current month index by previous year
same month index less 1.
Month-on-month growth rates are computed by dividing the current month index by previous
month index less 1.
TABLE 1-B Volume of Production Index, December 2013– January 2014
(2000 = 100)
|
Gainers |
Year-on-Year Growth (%) |
|
|---|---|---|
| January 2014 |
December 2013
(revised)
|
|
|
Machinery except electrical |
44.5 |
60.6 |
|
Electrical machinery |
13.1 |
15.7 |
|
Furniture and fixtures |
237.4 |
187.1 |
|
Tobacco products |
68.9 |
44.4 |
|
Chemical products |
15.8 |
230.4 |
|
Publishing and printing |
52.1 |
6.5 |
|
Textiles |
31.5 |
-13.6 |
|
Food manufacturing |
3.1 |
-4.6 |
|
Petroleum products |
3.9 |
-8.7 |
|
Fabricated metal products |
23.8 |
19.2 |
|
Non-metallic mineral products |
11.2 |
5.9 |
|
Rubber and plastic products |
9.2 |
23.5 |
|
Leather products |
21.0 |
48.6 |
|
Wood and wood products |
7.0 |
6.1 |
|
Transport equipment |
0.7 |
39.4 |
|
Losers |
Year-on-Year Growth (%) |
|
|---|---|---|
| January 2013 |
December 2013
(revised)
|
|
|
Basic metals |
-23.9 |
-20.5 |
|
Footwear and wearing apparel |
-25.2 |
-30.7 |
|
Miscellaneous manufactures |
-26.7 |
-43.6 |
|
Paper and paper products |
-8.8 |
-7.2 |
|
Beverages |
-0.6 |
-5.3 |
TABLE 1-B Volume of Production Index, December 2013 – January 2014
(2000 = 100) (concluded)
|
Gainers |
Month-on-Month Growth (%) |
|
|---|---|---|
|
January 2014 |
December 2013
(revised)
|
|
|
Miscellaneous manufactures |
17.3 |
-16.3 |
|
Publishing and printing |
17.6 |
-13.2 |
|
Transport equipment |
2.6 |
-11.2 |
|
Fabricated metal products |
2.8 |
3.5 |
|
Losers |
Month-on-Month Growth (%) |
|
|---|---|---|
|
January 2014 |
December 2013
(revised)
|
|
|
Chemical products |
-67.8 |
6.2 |
|
Footwear and wearing apparel |
-40.8 |
30.7 |
|
Tobacco products |
-51.7 |
0.4 |
|
Machinery except electrical |
-8.4 |
-4.8 |
|
Electrical machinery |
-2.6 |
-2.0 |
|
Petroleum products |
-2.1 |
35.0 |
|
Non-metallic mineral products |
-4.8 |
-0.5 |
|
Beverages |
-2.8 |
13.7 |
|
Food manufacturing |
-0.7 |
-2.3 |
|
Paper and paper products |
-5.9 |
-3.5 |
|
Rubber and plastic products |
-2.2 |
-4.7 |
|
Basic metals |
-1.1 |
-9.7 |
|
Textiles |
-2.3 |
10.0 |
|
Furniture and fixtures |
-2.7 |
13.3 |
|
Wood and wood products |
-3.4 |
-16.1 |
|
Leather products |
-7.4 |
7.9 |
Notes: Major Industries are ranked according to their contribution to the overall 2000-based January 2014 growth rate.
Year-on-year growth rates are computed by dividing the current month index by previous year
same month index less 1.
Month-on-month growth rates are computed by dividing the current month index by previous
month index less 1.
TABLE 2-A Value of Net Sales Index, December 2013– January 2014
(2000 =100)
|
Gainers |
Year-on-Year Growth (%) |
|
|---|---|---|
| January 2014 |
December 2013
(revised)
|
|
|
Chemical products |
111.7 |
264.0 |
|
Machinery except electrical |
50.3 |
29.7 |
|
Petroleum products |
16.5 |
17.4 |
|
Electrical machinery |
9.3 |
6.3 |
|
Food manufacturing |
5.3 |
-5.9 |
|
Fabricated metal products |
30.4 |
30.9 |
|
Transport equipment |
7.1 |
12.7 |
|
Tobacco products |
15.8 |
8.7 |
|
Furniture and fixtures |
37.0 |
132.5 |
|
Miscellaneous manufactures |
12.7 |
-4.7 |
|
Publishing and printing |
20.7 |
4.6 |
|
Rubber and plastic products |
17.0 |
10.6 |
|
Paper and paper products |
5.9 |
7.3 |
|
Non-metallic mineral products |
3.3 |
-7.7 |
|
Leather products |
32.9 |
40.8 |
|
Textiles |
2.4 |
21.6 |
|
Losers |
Year-on-Year Growth (%) |
|
|---|---|---|
|
January 2014 |
December 2013
(revised)
|
|
|
Basic metals |
-26.3 |
-30.4 |
|
Footwear and wearing apparel |
-20.4 |
-26.5 |
|
Beverages |
-2.5 |
-25.5 |
|
Wood and wood products |
-14.2 |
11.0 |
TABLE 2-A Value of Net Sales Index, December 2013– January 2014
(2000 = 100) (concluded)
|
Gainers |
Month-on-Month Growth (%) |
|
|---|---|---|
| January 2014 |
December 2013
(revised)
|
|
|
Electrical machinery |
6.4 |
-2.0 |
|
Miscellaneous manufactures |
15.8 |
-1.6 |
|
Textiles |
12.8 |
1.8 |
|
Beverages |
4.1 |
-13.1 |
|
Publishing and printing |
13.0 |
-12.1 |
|
Basic metals |
2.8 |
-16.9 |
|
Tobacco products |
5.5 |
-7.4 |
|
Paper and paper products |
4.9 |
-8.7 |
|
Machinery except electrical |
0.7 |
-1.1 |
|
Fabricated metal products |
2.5 |
6.6 |
|
Losers |
Month-on-Month Growth (%) |
||
|---|---|---|---|
|
January 2014 |
December 2013
(revised)
|
||
|
Chemical products |
-57.2 |
7.2 |
|
|
Food manufacturing |
-8.6 |
4.0 |
|
|
Footwear and wearing apparel |
-36.8 |
28.3 |
|
|
Petroleum products |
-3.1 |
10.6 |
|
|
Non-metallic mineral products |
-10.3 |
0.9 |
|
|
Transport equipment |
-2.8 |
-0.3 |
|
|
Wood and wood products |
-8.8 |
-8.7 |
|
|
Leather products |
-12.5 |
5.6 |
|
|
Rubber and plastic products |
-1.6 |
-7.0 |
|
|
Furniture and fixtures |
-0.2 |
9.6 |
|
Notes: Major Industries are ranked according to their contribution to the overall 2000-based January 2014 growth rate.
Year-on-year growth rates are computed by dividing the current month index by previous year
same month index less 1.
Month-on-month growth rates are computed by dividing the current month index by previous
month index less 1.
TABLE 2-B Volume of Net Sales Index, December 2013– January 2014
(2000 = 100)
|
Gainers |
Year-on-Year Growth (%) |
|
|---|---|---|
|
January 2014 |
December 2013
(revised)
|
|
|
Chemical products |
112.1 |
277.7 |
|
Machinery except electrical |
47.2 |
44.7 |
|
Furniture and fixtures |
115.0 |
259.6 |
|
Petroleum products |
8.0 |
2.9 |
|
Electrical machinery |
4.6 |
3.0 |
|
Food manufacturing |
3.4 |
-2.9 |
|
Fabricated metal products |
34.1 |
35.6 |
|
Tobacco products |
16.1 |
17.3 |
|
Transport equipment |
7.2 |
21.6 |
|
Publishing and printing |
20.7 |
-4.1 |
|
Rubber and plastic products |
16.0 |
19.9 |
|
Paper and paper products |
4.2 |
12.9 |
|
Leather products |
31.7 |
39.1 |
|
Textiles |
2.8 |
19.6 |
|
Miscellaneous manufactures |
0.5 |
-15.5 |
|
Non-metallic mineral products |
0.0 |
-8.0 |
|
Losers |
Year-on-Year Growth (%) |
|
|---|---|---|
| January 2014 |
December 2013
(revised)
|
|
|
Basic metals |
-20.3 |
-23.8 |
|
Footwear and wearing apparel |
-22.5 |
-28.9 |
|
Beverages |
-3.1 |
-29.2 |
|
Wood and wood products |
-15.1 |
7.3 |
TABLE 2-B Volume of Net Sales Index, December 2013– January 2014
(2000 = 100) (concluded)
|
Gainers |
Month-on-Month Growth (%) |
|
|---|---|---|
| January 2014 |
December 2013
(revised)
|
|
|
Electrical machinery |
4.4 |
-2.4 |
|
Miscellaneous manufactures |
11.1 |
-1.8 |
|
Petroleum products |
2.1 |
3.8 |
|
Textiles |
11.9 |
1.8 |
|
Beverages |
3.8 |
-13.1 |
|
Publishing and printing |
13.0 |
-12.1 |
|
Basic metals |
3.3 |
-17.7 |
|
Tobacco products |
5.7 |
-7.4 |
|
Paper and paper products |
3.7 |
-8.5 |
|
Fabricated metal products |
2.5 |
6.9 |
|
Furniture and fixtures |
4.3 |
10.8 |
|
Losers |
Month-on-Month Growth (%) |
|
|---|---|---|
|
January 2014 |
December 2013
(revised)
|
|
|
Chemical products |
-56.7 |
6.8 |
|
Food manufacturing |
-8.6 |
3.4 |
|
Footwear and wearing apparel |
-38.5 |
27.7 |
|
Machinery except electrical |
-3.7 |
-2.3 |
|
Non-metallic mineral products |
-11.1 |
1.2 |
|
Transport equipment |
-2.8 |
0.2 |
|
Wood and wood products |
-9.8 |
-8.9 |
|
Leather products |
-12.6 |
5.5 |
|
Rubber and plastic products |
-2.5 |
-7.3 |
Notes: Major Industries are ranked according to their contribution to the overall 2000-based January 2014 growth rate.
Year-on-year growth rates are computed by dividing the current month index by previous year
same month index less 1.
Month-on-month growth rates are computed by dividing the current month index by previous
month index less 1.