Birth, Marriage, and Death Statistics for 2023 (Provisional, as of 30 April 2024)
Explanatory Notes
| Data on marriages presented here were obtained from the Certificates of Marriage (Municipal Form No. 97) that were registered at the Office of the City/Municipal Civil Registrars all throughout the country and forwarded to the Philippine Statistics Authority. Information presented includes registered marriages which occurred from January to December 2017 and received at the Civil Registration Service until 31 March 2018. Figures presented are not adjusted for under registration. Marriages of Filipinos abroad which were reported to the Philippine Foreign Service Posts are presented in a separate report. |
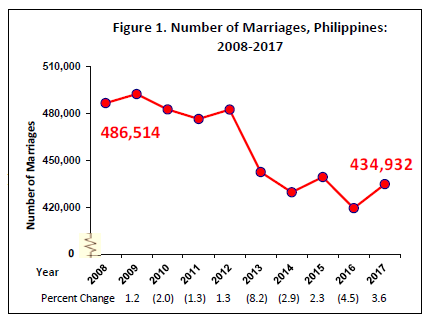
Increasing number of marriages
In 2017, the total number of marriages recorded was 434,932, an increase of
The decrease in marriages in a span of 10 years changed from
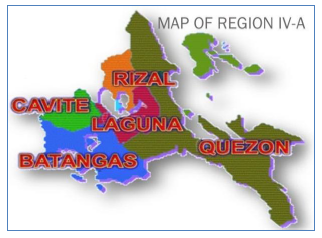
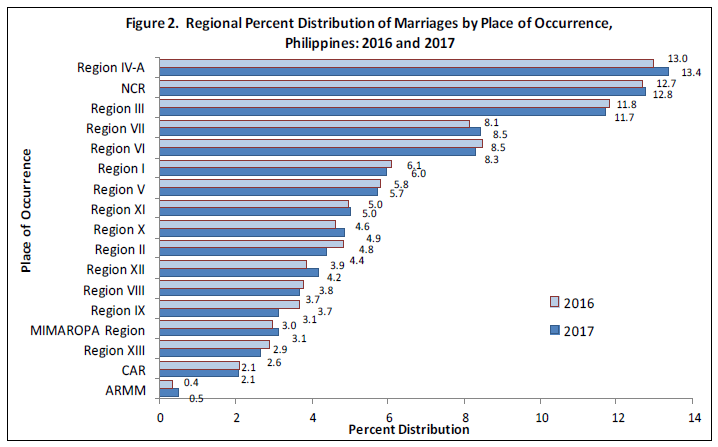
Highest number of marriages in CALABARZON
In 2017, Region IV-A recorded the highest number of registered marriages, which accounted for
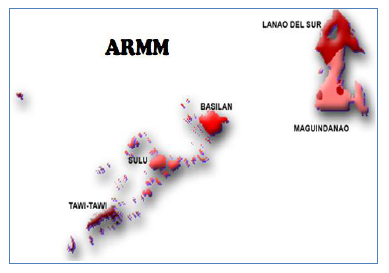
Fourteen regions with positive percent change
Fourteen out of seventeen regions showed a positive percent change from 2016 to 2017. The top three regions with positive percent change found in Mindanao area. The highest increase was observed in ARMM with
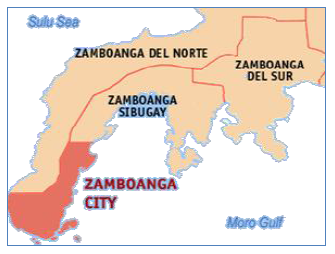
Among the three regions with negative percent change, Zamboanga Peninsula had the highest decrease of
Most number of couples married in May
Women married younger than men One-third of the total number of marriages in 2017 was recorded in the months of May (

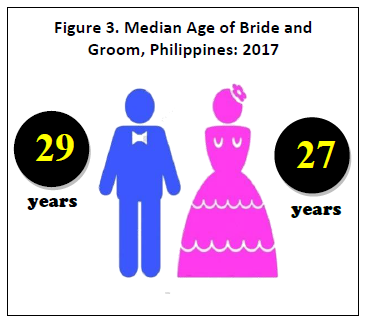
Women married younger than men
The median age of women that got married in 2017 was two years lower than the median age of their male counterparts. It was observed that the median age for men and women went up a single year from last year. (
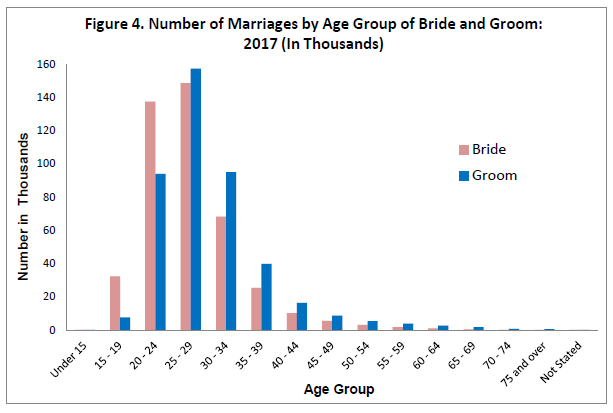
Most brides and grooms married between ages 25-29 years old
About one third of the brides and the grooms married between ages 25-29 years old, where grooms with 157,407 or
It was also observed that there are four teenage brides (32,404) for every one teenage groom (7,609) for marriages involving teenagers. (
Filipino brides and grooms also marry other nationalities
There were 419,675 marriages (
Among foreign nationals, the highest frequency of intermarriages involved Filipino grooms and Australians (298) followed by Chinese (273), Americans (162), Canadians (135) and Japanese (123) Japanese brides.

On the other hand, the highest number of intermarriages involved Filipino brides and American grooms (3,168), followed by Japanese (1,490). (

Four out of ten marriages contracted through civil rites
There were 1,192 marriages solemnized daily through different types of ceremony.
Of the total marriages in 2017,
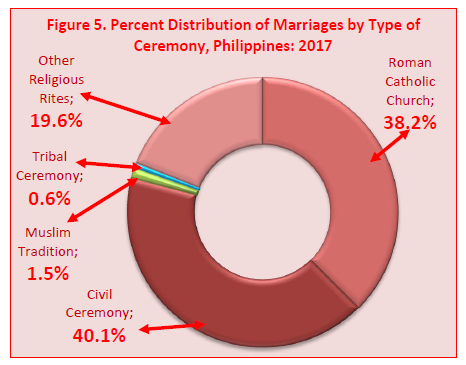
It could be noted that more brides and grooms aged 25-29 years old preferred to be solemnized in the Roman Catholic Church than any other types of marriage ceremony. (
LISA GRACE S. BERSALES, Ph.D.
Undersecretary
National Statistician and Civil Registrar General