
Call centers and other related activities industry posts the highest number of establishments
The 2016 Annual Survey of Philippine Business and Industry (ASPBI) preliminary results for the formal sector of the economy recorded a total of 1,872 establishments with total employment (TE) of 20 and over in Administrative and Support Service Activities sector.
The highest number of establishments was recorded in call centers and other related activities with 590 establishments or 31.5 percent of the total number of establishments for the sector. Activities of employment placement agencies followed closely with 510 establishments (27.2%). Establishments engaged in private security activities ranked third with 358 establishments (19.1%). Figure 1 shows the percentage distribution of establishments with TE of 20 and over by industry group for the sector in 2016.
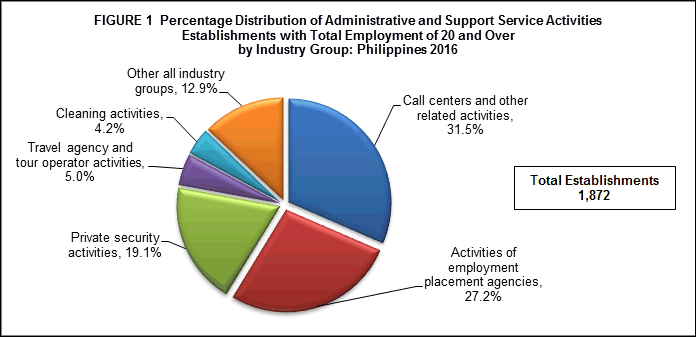
Among the regions in the Philippines, the National Capital Region (NCR) contributed the highest number of establishments of 1,179 (63.0%). Followed afar were Central Visayas and CALABARZON with 180 establishments (9.6%) and 129 establishments (6.9%), respectively.
Majority of workers come from call centers and other related activities industry
In 2016, the sector employed a total of 1,020,449 workers, in which 1,019,827 were paid employees and the rest were working owners or unpaid workers.
Among industries, call centers and other related activities posted the highest number of workers of 535,500 workers or 52.5 percent of the total employment of the sector. Activities of employment placement agencies followed with 201,659 workers (19.8%). Third in rank was the private security activities with 113,674 workers (11.1%). Figure 2 shows the distribution of employment for establishments with TE of 20 and over by industry group for the sector in 2016.
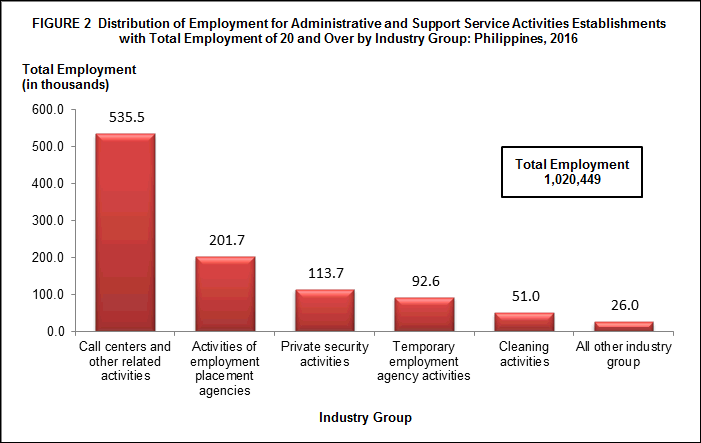
Across regions, majority of the workers were in NCR, which employed a total of 620,477 workers or 60.8 percent of the total. Central Visayas placed second with 101, 031 workers (9.9%) and CALABARZON ranked third with 90,355 workers (8.9%).
Office administrative and support activities industry pays the highest average annual compensation
Total compensation paid by the sector to its employee amounted to PHP253.6 billion, translating to an average annual compensation of PHP248.7 thousand per employee.
Industry-wise, the office administrative and support activities paid the highest average annual compensation amounting to PHP576.1 thousand per employee while other human resources provision paid the lowest average annual compensation with PHP68.0 thousand per employee. Figure 3 shows the average annual compensation for establishments with TE of 20 and over by industry group for the sector in 2016.
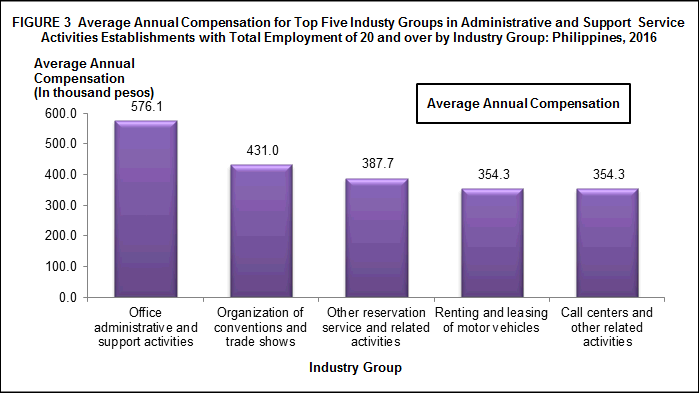
At the regional level, workers in NCR received the highest average annual compensation of PHP297.6 thousand per employee while those employed in Zamboanga Peninsula received the lowest average annual compensation of PHP61.1 thousand per employee.
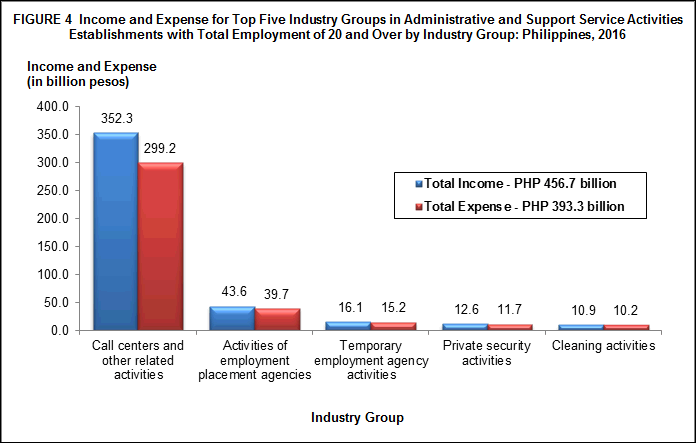
Call centers and other related activities industry generates the highest income and expense
Total income generated by the sector for establishments with TE of 20 and over was estimated at PHP456.7 billion in 2016.
Among industries, call centers and other related activities generated the highest income of PHP352.3 billion or 77.1 percent of the total income of the sector. Other industries with more than 10 billion income were as follows:
- Activities of employment placement agencies, PHP43.6 billion
- Temporary employment agency activities, PHP16.1 billion
- Private security activities, PHP12.6 billion
- Cleaning activities, PHP10.9 billion
The sector’s total expense totaled to PHP393.2 billion. Call centers and other related activities industry, which led in terms of income generation, also topped in terms of total expense amounting to PHP299.2 billion (76.1%). On the other hand, investigation activities had the lowest expense of PHP67.1 million (0.02%). Figure 4 shows the top five industry groups in income and expense for establishments with TE of 20 and over by industry group for the sector in 2016.
Region-wise, NCR had the highest income and expense which accounted for almost three-fourths of the total income and expense of the sector, amounting to PHP334.3 billion and PHP290.0 billion, respectively. Cagayan Valley reported the least income and expense with PHP59.1 million and PHP54.8 million, respectively.
Income-expense ratio holds at 1.16
The sector generated an income per expense ratio of 1.16 in 2016. This means that for every peso spent, a corresponding income of PHP1.16 was generated.
Across industries, renting and leasing of other machinery, equipment and tangible goods, n.e.c. posted the highest income per expense ratio of 1.37 while other human resources provision recorded the lowest ratio of 0.91. Below were the industries that surpassed the national average ratio:
- Combined facilities support activities, 1.26
- Travel agency and tour operator activities, 1.25
- Business support service activities, n.e.c., 1.22
- Renting and leasing of personal and household goods, 1.19
- Call center and other related activities, 1.18
- Other reservation service and related activities, 1.17
Value added of the sector reaches to PHP331.4 billion
The estimated value added for the sector in 2016 was PHP331.4 billion. Call centers and other related activities registered the highest value added with PHP249.8 billion (75.4%). This was followed by activities of employment placement agencies with PHP34.8 billion (10.5%) and temporary employment agency with PHP14.2 billion (4.3%).
Among regions, the top three generated a total of PHP290.0 billion or 87.5 percent of the total value added of the sector. NCR remained the lead among regions generating PHP242.2 billion or 73.1 percent share to total. Central Visayas and CALABARZON followed with PHP30.1 billion (9.1%) and 17.6 billion (5.3%), respectively. Cagayan Valley contributed the least value added amounting to PHP56.5 million (0.02%).
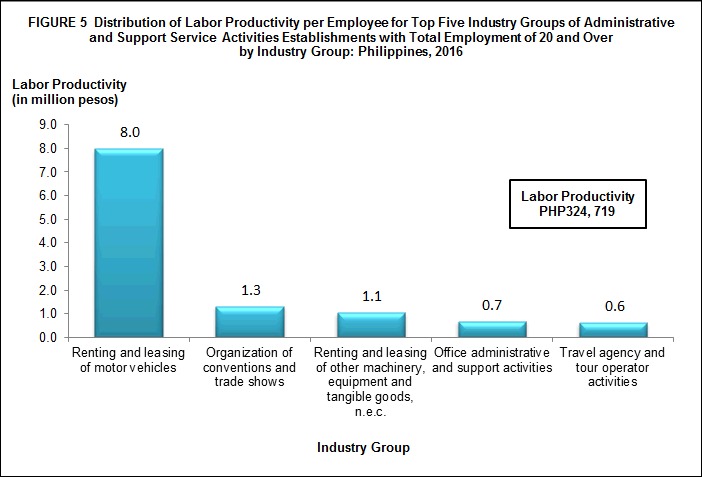
Labor productivity of the sector is PHP324.7 thousand per worker
Labor productivity (ratio of value added per worker) was estimated at PHP324.7 thousand per worker for establishments with TE of 20 and over of this sector.
The highest labor productivity was posted by renting and leasing of motor vehicles with PHP8.0 million per worker. This was followed by organization of conventions and trade shows with PHP1.3 million per worker. Third in rank was the renting and leasing of other machinery, equipment and tangible goods, n.e.c. with PHP1.1 million per worker. On the other hand, other human resources provision recorded the least labor productivity of PHP65.5 thousand per worker. Figure 5 shows the distribution of labor productivity for the top five industry groups for establishments with TE of 20 and over for the sector in 2016.
At the regional level, NCR had the highest labor productivity with PHP390.3 thousand per worker. Cordillera Administrative Region (CAR) came next with PHP308.4 thousand per worker. Meanwhile, least labor productivity amounting to PHP69.7 thousand per worker was recorded in SOCCSKSARGEN.
Gross additions to tangible fixed assets of the sector stands at PHP16.1 billion
Gross additions to tangible fixed assets, defined as capital expenditures less sale of fixed assets, was valued PHP16.1 billion for establishments with TE of 20 and over of the sector.
Call centers and other related activities which shared 82.4 percent to the total gross additions to tangible fixed assets, gave biggest percent share among industries amounting to PHP13.2 billion.
By region, NCR contributed the highest additions to fixed assets worth PHP11.2 billion or 69.7 percent of the total.
Total change in inventory records PHP6.8 million
Total change in inventories (ending less beginning inventory) for the sector was estimated at PHP6.8 million. Renting and leasing of other machinery, equipment and tangible goods, n.e.c. had the highest change in inventory with PHP44.6 million. Activities of employment placement agencies and temporary employment agency activities followed with PHP14.2 million and PHP12.2 million change in inventories, respectively.
Total subsidies received from the government amounts to PHP9.2 billion
Total subsidies provided to the sector by the government reached PHP9.2 billion and this was granted only to the call centers and other related activities. These subsidies were distributed to Central Visayas (PHP27.2 million) and Negros Island Region (PHP145.6 million).
Sales from e-commerce shares 0.13 percent to the total income of the sector
In 2016, sales from e-commerce amounting to PHP603.6 million shared 0.13 percent to the total income generated by the sector. The following were the only industries that contributed to the sales from e-commerce of the sector:
- Call centers and other related activities, PHP484.8 million
- Travel agency and tour operator activities, PHP118.9 million
TECHNICAL NOTES
Introduction
This Special Release presents the preliminary results of the 2016 Annual Survey of Philippine Business and Industry (ASPBI) for Administrative and Support Service Activities sector for establishments with total employment of 20 and over.
The ASPBI is one of the designated statistical activities of the Philippine Statistics Authority (PSA). Data collected from the survey provide information on the levels, structure, performance, and trends of economic activities of the formal sector in the entire country for the year 2016.
The survey was conducted nationwide in 2017 with 2016 as the reference period, except for employment where the reference period is 15 November 2016.
Establishment Data Management System (EDMS) was utilized in the decentralized processing of 2016 ASPBI questionnaires in the provinces as well as the online accomplishment of questionnaire through the PSA website.
Data are presented by industry group or 3-digit 2009 Philippine Standard Industrial Classification (PSIC) at the national/regional level.
Legal Authority
The conduct of the 2016 ASPBI is authorized under Republic Act 10625 known as the Philippine Statistical Act of 2013, which mandates reorganizing and strengthening of the Philippine Statistical System (PSS), its agencies and instrumentalities.
Scope and Coverage
The 2016 ASPBI covered establishments engaged in 18 economic sectors classified under the 2009 PSIC, namely:
- Agriculture, Forestry and Fishing (A)
- Mining and Quarrying (B)
- Manufacturing (C)
- Electricity, Gas, Steam, and Air Conditioning Supply (D)
- Water Supply; Sewerage, Waste Management and Remediation Activities (E)
- Construction (F)
- Wholesale and Retail Trade; Repair of Motor Vehicles and Motorcycles (G)
- Transportation and Storage (H)
- Accommodation and Food Service Activities (I)
- Information and Communication (J)
- Financial and Insurance Activities (K)
- Real Estate Activities (L)
- Professional, Scientific and Technical Activities (M)
- Administrative and Support Service Activities (N)
- Education (P)
- Human Health and Social Work Activities (Q)
- Arts, Entertainment and Recreation (R)
- Other Service Activities (S)
The survey was confined to the formal sector of the economy, which consists of the following:
- Corporations and partnerships
- Cooperatives and foundations
- Single proprietorship with employment of 10 and over
- Single proprietorship with branches
Hence, the 2016 ASPBI covered only the following economic units:
- All establishments with total employment (TE) of 10 or more, and;
- All establishments with TE of less than 10, except those establishments with Legal Organization = 1 (single proprietorship) and Economic Organization = 1 (single establishment), that are engaged in economic activities classified according to the 2009 Philippine Standard Industrial Classification (PSIC).
Frame of Establishments
The frame for the 2016 ASPBI was extracted from the 2016 List of Establishments (LE). The estimated number of establishments in operation in the country in 2016 totaled to 902,213. About 294,494 establishments (32.6% of the total establishments) belong to the formal sector of which 255,403 (86.7%) comprised the establishment frame. This frame was used to draw the sample establishments for the survey.
Unit of Enumeration
The unit of enumeration for the 2016 ASPBI is the establishment. An establishment is defined as an economic unit under a single ownership or control which engages in one or predominantly one kind of activity at a single fixed location.
Taxonomy of Establishments
An establishment is categorized by its economic organization, legal organization, industrial classification, employment size and geographic location.
Economic Organization refers to the organizational structure or role of the establishment in the organization. An establishment may be single establishment, branch, establishment and main office with branches elsewhere, main office only, and ancillary unit other than main office.
Legal Organization refers to the legal form of the economic entity which owns the establishment. An establishment may be single proprietorship, partnership, government corporation, stock corporation, non-stock corporation, and cooperative.
Industrial Classification of an economic unit was determined by the activity from which it derives its major income or revenue. The 2009 PSIC which was approved for adoption by government agencies and instrumentalities through PSA Resolution No. 01 Series of 2017-158 signed on 14 February 2017 was utilized to classify economic units according to their economic activities.
Size of an establishment is determined by its total employment (TE) as of specific date. Total employment (TE) refers to the total number of persons who work in or for the establishment.
This includes paid employees, working owners, unpaid workers and all employees who work full-time or part-time including seasonal workers. Included also are persons on short term leave such as those on sick, vacation or annual leaves and on strike.
Geographic Classification refers to the grouping of establishments by geographic area using the Philippine Standard Geographic Code (PSGC) classification. The PSGC contains the latest updates on the official number of regions, provinces, cities, municipalities, and barangays in the Philippines. The PSGC as of 31 December 2016 was used for the 2016 ASPBI.
Sampling Design
The 2016 ASPBI uses a stratified systematic sampling with 3-digit or 5-digit PSIC serving as industry strata and employment size as the second stratification variable. The selection of sample establishments is done independently by stratum using systematic sampling.
For establishments with TE of 20 and over, the 18 administrative regions serve as the geographic domains while the 5-digit level of the 2009 PSIC serves as the industry domains.
Estimation Procedure for Establishments with TE of 20 and Over
a. Non-Certainty Stratum (strata of TE 20 to 49 and TE 50 to 99)
Sections A, C, E, F, G, H, I, J, K, L, M, N, P, Q, R and S.
The estimate of the total of a characteristic  for the non-certainty employment strata in TE of 20 and over for an industry domain in each region

where:
s = denotes the non-certainty employment strata in TE of 20 and over
p = 1, 2,..., 18 regions (geographic domains)
Xspj = value of the jthestablishment in the non-certainty employment strata with TE of 20 and over for an industry domain in each region
j = 1,2,3,..., nsp establishments
Wspj = weight of the jth establishment in the non-certainty employment strata with TE of 20 and over for an industry domain in each region
Nsp = total number of establishments in the non-certainty employment strata in TE of 20 and over for an industry domain in each region
nsp = number of sample establishments in the non-certainty employment strata in TE of 20 and over for an industry domain in each region
b. Certainty Stratum (Establishments under the following: Section B, D and J, ICT core industries, BPM industries, GOCC's and with TE 100 and over)
 for the certainty employment stratum in an industry domain in each region
where:
c = denotes the certainty employment strata in TE of 20 and over
p = 1,2,...18 regions (geographic domains)
Xcpj = value of the jthestablishment in the non-certainty employment strata in TE of 20 and over for an industry domain in each region
j = 1,2,3,..., mcp establishments
mcp = number of establishments in the certainty employment strata in TE of 20 and over in an industry domain within each region
c. Total Estimate for TE of 20 and Over
The estimate of the total of a characteristic  for the industry domain in each region (geopraphic domain) is obtained by aggregating the estimated for all employment strata (non-certainty and certainty) in the same industry domain,
where d denotes the industry domain and p refers to region
National level estimate of the the characteristics by industry domain are obtained by aggregating separately the estimates  for the particular industry domain from all the regions,
Weight Adjusment Factor for Non-Response
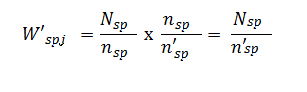
To account for non-response in the non-certainty strata, the adjusment factors, and (n/n') was multipled with the sampling weight (W) of each of the sampling unit. The sampling weight which is defined as N/n was recomputed as

Thus, the adjusted weight (W'spj) for the non-certainty employment stratum for the industry domain with TE 20-99 was
Where:
Nsp = total number of establishments in the non-certainty employment stratum with TE 20-99 for the industry domain within each geographic domain (region)
n'sp = number of responding establishments in the non-certainty employment stratum with TE of 20-99 for the industry domain within each geographic domain (region)
Response Rate
Response rate for Administrative and Support Service Activities sector for establishments with TE of 20 and over was 93.4 percent (1,638 out of 1,754 establishments). This included receipts of "good" questionnaires, partially accomplished questionnaires, reports of closed, moved out or out of scope establishments.
Of the total responses, 49 establishments responded online.
Reports of the remaining non-reporting establishments were taken from other available administrative data sources and financial statements from Securities and Exchange Commission (SEC). However, there were establishments which were found to be duplicates, out-of-scope and out of business in 2016.
Limitation of Data
Only the formal sector was covered in the survey.
Concepts and Definitions of Terms
Establishment is an economic unit under a single ownership and control, i. e. under a single entity, engaged in one or predominantly one kind of economic activity at a single fixed location.
Economic activity is the establishment’s source of income. If the establishment is engaged in several activities, its main economic activity is that which earns the biggest income or revenue.
Total employment is the number of persons who worked in for the establishment as of 15 November 2016.
Paid employees are all persons working in the establishment and receiving pay, as well as those working away from the establishment paid by and under the control of the establishment. Included are all employees on sick leave, paid vacation or holiday. Excluded are consultants, home workers, receiving pure commissions only, and workers on indefinite leave.
Compensation is the sum of salaries and wages, separation/retirement/terminal pay, gratuities, and payments made by the employer in behalf of the employees such as contribution to SSS/GSIS, ECC, PhilHealth, Pag-ibig, etc.
Salaries and wages are payments in cash or in kind to all employees, prior to deductions for employee’s contributions to SSS/GSIS, withholding tax, etc. Included are total basic pay, overtime pay and other benefits.
Income or Revenue refers to cash received and receivables for goods/products and by-products sold and services rendered. Valuation is at producer prices (ex-establishment) net of discounts and allowances, including duties and taxes but excluding subsidies.
E-commerce refers to the selling of products or services over electronic systems such as Internet Protocol-based networks and other computer networks. Electronic Data Interchange (EDI) network, or other on-line system. Excluded are orders received from telephone, facsimile and e-mails.
Expense refers to cost incurred by the establishment during the year whether paid or payable. This is treated on a consumed basis. Valuation is at purchaser price including taxes and other charges, net of rebates, returns and allowances. Goods and services received by the establishment from other establishments of the same enterprise are valued as though purchased.
Value added is gross output less intermediate input. Gross output for Administrative and Support Service Activities sector is the sum of the total income (less interest income, rent income from land, dividend income, royalty income and franchise income), capital expenditures of fixed assets produced on own account and change in inventories. Intermediate input is equal to the sum of the following expense items: materials and supplies purchased; fuels, lubricants, oils and greases purchased; electricity purchased, water purchased; industrial services done by others; non-industrial services done by others (less rent expense for land); goods purchased for resale; research and development expense; environmental protection expense; royalty fee; franchise fee; and other expense.
Change in inventories is equivalent to the value of inventories at the end of the year less the value of inventories at the beginning of the year.
Inventories refer to the stock of goods owned by and under the control of the establishment as of a fixed date, regardless of where the stocks are located. Valuation is at current replacement cost in purchaser prices. Replacement cost is the cost of an item in terms of its present price rather than its original cost.
See more at the Annual Survey of Philippine Business and Industry (ASPBI) page.