
EXTERNAL TRADE PERFORMANCE
FEBRUARY 2013
(Preliminary)

p-preliminary
r-revised


FEBRUARY 2013 TOTAL TRADE STAND AT $8.449 BILLION
Total external trade in goods for February 2013 reached $8.449 billion, representing a 10.4 percent decrease from $9.427 billion recorded during the same month in 2012. This was due to the 5.8 percent downward trend of total imports from $4.996 billion to $4.708 billion in February 2013. Similarly, exports showed a 15.6 percent decrement from $4.430 billion to $3.741 billion in February 2013. Thus, the balance of trade in goods (BOT-G) for the Philippines in February 2013 registered a deficit of $967 million from $566 million deficit in the same period last year.

FEBRUARY 2013 IMPORTS DOWN BY 5.8 PERC
The country’s total merchandise imports for this month went down by 5.8 percent from $4.996 billion to $4.708 billion in February 2013. Furthermore, it decreased by 0.4 percent from $4.727 billion compared to previous month’s level. The down fall was supported by eight out of ten major commodity groups whose year-on-year change was negative. These were as follows: transport equipment; organic and inorganic chemicals; plastics in primary and non-primary forms; electronic products; iron and steel; telecommunication equipment and electrical machinery; industrial machinery and equipment; and other food and live animals. Aggregate imports for the first two months of 2013 did showed a decline in year-on-year change of 6.9 percent. Recorded value was $10.130 billion in 2012 to $9.435 billion in 2013.
ELECTRONIC PRODUCTS ACCOUNT FOR 26.5 PERCENT OF IMPORT BILL
Accounting for 26.5 percent of the aggregate import bill, payments for Electronic Products (including consigned and direct importation using the expanded coverage of electronic products) in February 2013 amounted to $1.248 billion. It went down by 12.6 percent over last year's figure of $1.428 billion. However, on a monthly basis, it grew by 9.0 percent from $1.145 billion recorded in January 2013. Similarly, volume of inward shipments registered a drop of 12.7 percent compared to same month volume a year ago. Among the major groups of electronic products, Components/Devices (Semiconductors), having the biggest share of 20.2 percent, decreased by 10.5 percent from $1.060 billion in February 2012 to $948.99 million in February 2013. Moreover, purchases of this product in terms of inward volume did register a drop of 44.6 percent compare to last year volume of shipment.
Imports of Mineral Fuels, Lubricants and Related Materials ranked second with 25.7 percent share and posted a positive annual growth rate of 20.2 percent to reported value of $1.209 billion in February 2013 from $1.006 billion in February 2012. Furthermore, volume in terms of gross kilos of this product grew by 22.3 percent compared to February 2012 volume of inward shipments.
Transport Equipment was the PH’s third top import for the month with 6.6 percent share to total imports valued at $311.55 million in February 2013. This figure went down by 31.1 percent from previous year level of $451.91 million. Inward shipment in terms of volume, it went down by 1.9 percent.
Industrial Machinery and Equipment, contributing 5.1 percent to the total import bill was the PH’s fourth top import for the month amounting to $238.95 million. It decelerated by 5.2 percent compared to last year’s value of $252.03 million. However, volume of this product grew by 9.1 percent over its last year volume.
Fifth in rank and with 2.9 percent share to the total imports, Other Food and Live Animals recorded $135.49 million worth of imports, lower by 2.1 percent from its year ago level of $138.41 million.
Rounding up the list of the top ten imports for February 2013 were Feeding Stuff for Animals (not including unmilled cereals) valued at $103.60 million and registered the highest annual growth rate of 57.5 percent among the top ten imports; Plastics in Primary and Non-Primary Forms amounting to $102.11 million; Telecommunication Equipment and Electrical Machinery, $95.94 million; Organic and Inorganic Chemicals, $94.77 million; and Iron and Steel, $94.12 million.
Aggregate payment for the country’s top ten imports for February 2013 reached $3.634 billion or 77.2 percent of the total import bill.

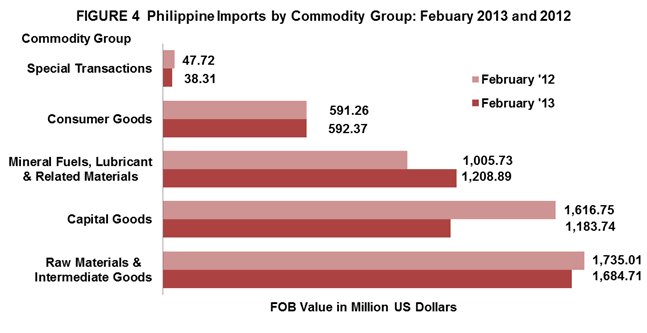
RAW MATERIALS AND INTERMEDIATE GOODS ACCOUNT FOR 35.8 PERCENT OF THE TOTAL IMPORTS
Accounting for 35.8 percent of the total imports, payments in February 2013 for Raw Materials and Intermediate Goods amounted to $1.685 billion or 2.9 percent decrement over last year's figure of $1.735 billion. Compared to the previous month’s level, purchases went down by 4.6 percent from $1.766 billion. Semi-Processed Raw Materials had the biggest share of 32.9 percent and valued at $1.549 billion. Volume of inward shipments of semi-processed raw materials slightly grew by 1.0 percent compared to last year volume. This was brought about by the increased in both value and volume of feeding stuff for animals at 57.5 percent and 1.3 percent, respectively.
Capital Goods, which comprised 25.1 percent of the total imports, went down by 26.8 percent year-on-year from $1.617 billion to $1.184 billion. Furthermore, purchases of this product in terms of volume, declined by 2.1 percent compare to February 2012 volume of inward shipment.
Mineral Fuels, Lubricants and Related Materials with 25.7 percent share to total imports increased by 20.2 percent to $1.209 billion from $1.006 billion in February 2012. Likewise, volume of this product grew by 22.3 percent compared to last year volume.
Purchases of Consumer Goods amounted to $592.37 million or a slight growth of 0.2 percent from $591.26 million in February 2012 while Special Transactions went down by 19.7 percent from $47.72 million to $38.31 million in February 2013.
IMPORTS FROM UNITED STATES OF AMERICA ACCOUNT FOR 11.6 PERCENT
United States of America (USA) including Alaska and Hawaii was the country’s biggest source of imports for February 2013 with 11.6 percent share of the total import bill, higher by 0.8 percent to $547.43 million from $542.92 million in February 2012. The increase in the inward purchases from USA includes importation of electronic products, feeding stuff for animals and wheat. Exports to USA amounted to $594.90 million, yielding a two-way trade value of $1.142 billion and a trade surplus for PH of $47.47 million.
People’s Republic of China was the second biggest source of imports with 11.5 percent share. Payments were recorded at $542.44 million, an increase of 21.7 percent from $445.58 million in February 2012. Commodities imported from China were mineral products and telecommunication equipment. Revenue from PH’s exports to China, on the other hand, reached $380.76 million, generating a total trade value of $923.20 million and $161.68 million trade deficit for the Philippines.
Japan including Okinawa came third, accounting for 9.4 percent share of the total import bill in February 2013 with negative growth of 33.4 percent from $667.22 million to $444.38 million. Components/devices (semiconductors) and land transport equipment were the recorded imported goods from Japan. Exports to Japan amounted to $705.93 million resulting to a total trade value of $1.150 billion and a trade surplus of $261.55 million.
Singapore settled fourth accounting for 8.8 percent share of the total import bill in February 2013 or a decrease of 1.9 percent from $424.16 million during the same month in 2012 to $415.90 million in February 2013. Commodities purchased from Singapore in February 2013 were mineral fuels and lubricants and components/devices. Exports to Singapore amounted to $263.14 million resulting to a total trade value of $679.03 million and a trade deficit of $152.76 million.
Fifth in rank was Republic of Korea, representing 8.5 percent of the total import bill in February 2013, amounted to $401.07 million. Mostly mineral, fuels and lubricants and components/devices (semiconductors) were among the highest imported goods from Korea in February 2013. Meanwhile, export receipts from Republic of Korea in February 2013 reached $231.81 million yielding a total trade value of $632.88 million and a trade deficit of $169.26 million.
Other major sources of imports for the month of February 2013 were Saudi Arabia, $379.56 million; Thailand $308.03 million; Taiwan, $307.01 million; Indonesia, $203.93 million; and Malaysia (including Sabah and Sarawak) $140.69 million.
Payments for imports from the top ten sources for February 2013 amounted to $3.690 billion or 78.4 percent of the total.

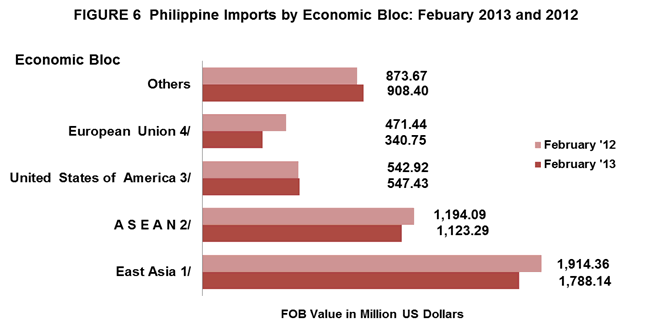
IMPORTS FROM EAST
Philippines total imports in February 2013 with East Asia (China, Hong Kong, Japan, Macau, Mongolia, North Korea, South Korea and Taiwan) accounted for 38.0 percent of the county’s total imports with total payments of $1.788 billion or a negative annual growth of 6.6 percent from February 2012 level of $1.914 billion. Total exports to member-countries of East Asia were valued at $1.660 billion, resulting to a total trade of $3.448 billion and a balance of trade in goods (BOT-G) deficit of $128.62 million.
Imports from ASEAN member-countries in February 2013, registered at $1.123 billion, contributed 23.9 percent share, lower by 5.9 percent from $1.194 billion registered in February 2012. Exports to ASEAN member-countries worth $588.85 million resulted to a total trade of $1.712 billion and a trade deficit of $534.44 million.
February 2013 imports from European Union were valued at $340.75 million. It fell by 27.7 percent compared to a year ago recorded value of $471.44 million while exports to member-countries of European Union were worth $461.62 million. This aggregated to total trade of $802.37 million and a trade surplus of $120.87 million.
Notes:
1/ - includes China, Hong Kong, Japan, Macau, Mongolia, N, Korea, S. Korea, Taiwan
2/ - includes Brunei Darussalam, Cambodia, Indonesia, Laos, Malaysia, Myanmar, Singapore, Thailand, Vietnam
3/ - includes Alaska and Hawaii
4/ - includes Austria, Belgium, Bulgaria, Cyprus, Czech Republic, Denmark, Estonia, Finland, France, Germany,
Greece, Hungary, Ireland, Italy, Latvia, Lithuania, Luxembourg, Malta, Netherlands, Poland, Portugal,
Romania, Slovakia, Slovenia, Spain, Sweden and UK Great Britain
Technical Notes:
- Adjustments on electronic import statistics are based on the transactions that pass through the Electronic to Mobile (e2m) of the Bureau of Customs (BOC).
- Starting with the 2007 Press Release, analysis and tables are based on the 2004 Philippine Standard Commodity Classification (PSCC) groupings. This is in compliance with NSCB Resolution No. 03, Series of 2005 entitled “Approving and Adopting the 2004 Philippine Standard Commodity Classification” by all concerned government agencies and instrumentalities.
CARMELITA N. ERICTA
Administrator
Source: Foreign Trade Statistics Section
Industry and Trade Statistics Department
National Statistics Office
Manila, Philippines