
EXTERNAL TRADE PERFORMANCE
JANUARY 2013
(Preliminary)
p-preliminary
r-revised

JANUARY 2013 TOTAL TRADE STANDS AT $8.735 BILLION
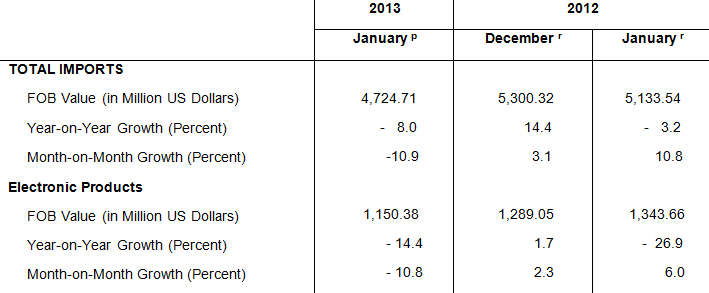
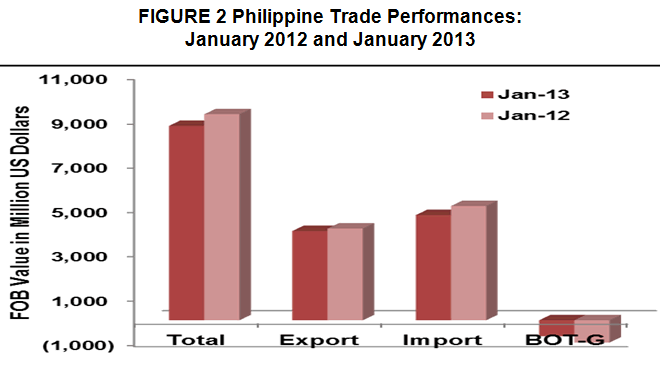
Total external trade in goods for January 2013 reached $8.735 billion, representing a 5.6 percent decrease from $9.257 billion recorded during the same month in 2012. This was due to the 8.0 percent downward trend of total imports from $5.134 billion to $4.725 billion in January 2013. Similarly, exports showed a 2.7 percent decrement from $4.123 billion in January 2012 to $4.011 billion. Thus, the balance of trade in goods (BOT-G) for the Philippines in January 2013 registered a deficit of $714 million from $1.010 billion deficit in the same period last year.
JANUARY 2013 IMPORTS DOWN BY 8.0 PERC
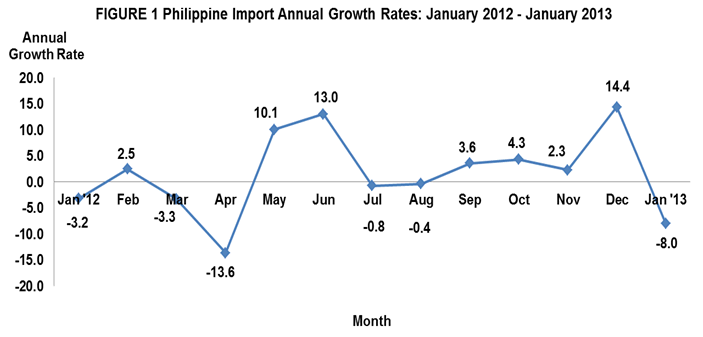
The country’s total merchandise imports for January 2013 declined by 8.0 percent compared to same month a year ago from $5.134 billion to $4.725 billion. The negative performance of purchases of products like mineral fuels, lubricants and related materials; organic and inorganic chemicals; electronic products and plastics in primary and non-primary forms contributed to the contraction of imports for January 2013. Furthermore, it decreased by 10.9 percent from $5.300 billion compared to previous month’s level.
ELECTRONIC PRODUCTS ACCOUNT FOR 24.4 PERCENT OF IMPORT BILL
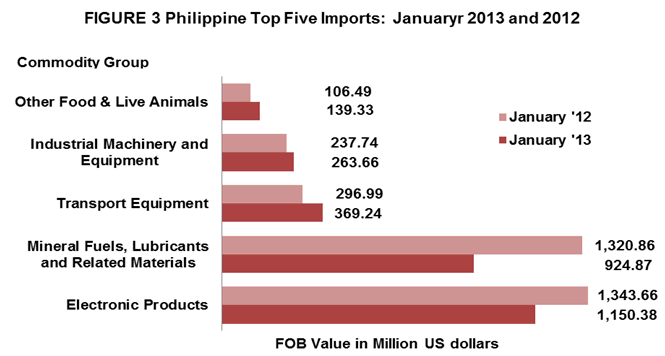
Accounting for 24.4 percent of the aggregate import bill, payments for Electronic Products (including consigned and direct importation using the expanded coverage of electronic products) in January 2013 amounted to $1.150 billion. It went down by 14.4 percent over last year's figure of $1.344 billion. Similarly, on a monthly basis, it dropped by 10.8 percent from $1.289 billion recorded in December 2012. Among the major groups of electronic products, Components/Devices (Semiconductors), having the biggest share of 17.6 percent, decreased by 17.6 percent from $1.007 billion to $829.46 million. However, volume of shipments for electronic products went up by 13.7 percent while semiconductors went down by 17.7 percent compared to same month a year ago volume of shipments.
Imports of Mineral Fuels, Lubricants and Related Materials in January 2013 ranked second with 19.6 percent share and posted the highest negative annual growth rate of 30.0 percent among the top ten imports for January 2013. The reported FOB value was from $1.321 billion in January 2012 to $924.87 million this year. The contraction may be attributed to the decrease in volume of shipments of this product.
Transport Equipment was the PH’s third top import for the month with 7.8 percent share to total imports valued at $369.24 million. This figure was up by 24.3 percent from previous year level of $296.99 million. Meanwhile, in terms of volume of inward shipments, it expanded by 55.6 percent compared to the recorded volume of inward shipments a year ago.
Industrial Machinery and Equipment contributing 5.6 percent to the total import bill was the PH’s fourth top import for the month amounting to $263.66 million. It accelerated by 10.9 percent compared to last year’s $237.74 million. Similarly, volume purchases went up by 25.3 percent from the same period last year.
Fifth in rank and with almost 3.0 percent share to the total imports, Other Food & Live Animals recorded $139.33 million worth of imports, higher by 30.8 percent from its year ago level of $106.49 million. Volume of shipments of this product also registered a 13.9 percent positive growth compared to January 2012.
Rounding up the list of the top ten imports for January 2013 were Iron and Steel accounting for $138.89 million; Plastics in Primary and Non-Primary Forms amounting to $127.08 million; Organic and Inorganic Chemicals, $123.71 million; Cereals and Cereal Preparations, registering the highest year-on-year change of 98.6 percent valued at $114.68 million; and Feeding Stuff For Animals, $109.10 million.
Aggregate payment for the country’s top ten imports for January 2013 reached $3.461 billion or 73.3 percent of the total import bill.
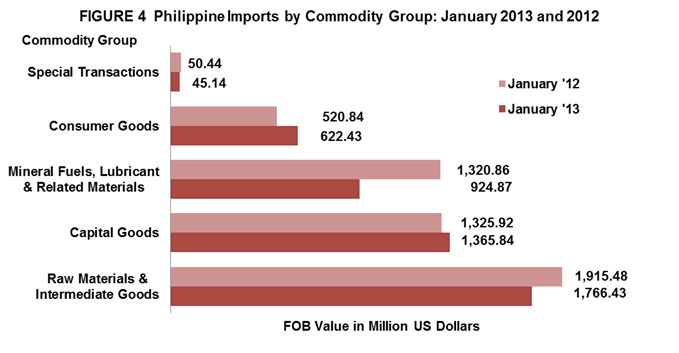
RAW MATERIALS AND INTERMEDIATE GOODS ACCOUNT FOR 37.4 PERCENT OF THE TOTAL IMPORTS
Accounting for 37.4 percent of the total imports, payments in January 2013 for Raw Materials and Intermediate Goods amounted to $1.766 billion or 7.8 percent decrement over last year's figure of $1.915 billion. Compared to the previous month’s level, purchases also went down by 4.9 percent from $1.857 billion. Semi-Processed Raw Materials had the biggest share of 31.7 percent and valued at $1.499 billion. However, volume of inward shipments for both raw materials and intermediate goods particularly semi-processed raw materials went up by 28.0 percent and 28.5 percent, respectively, compared to same month a year ago volume of shipments.
Capital Goods, which comprised 28.9 percent of the total imports, went up by 3.0 percent year-on-year to $1.366 billion from $1.326 billion. Similarly, volume of these products also went up by 30.5 percent compared to January 2012.
Mineral Fuels, Lubricants and Related Materials, with 19.6 percent share to total imports, decreased by 30.0 percent from $1.321 billion in January 2012 to $924.87 million in January 2013. The decline in value can be attributed to the 19.6 percent drop in volume of shipments.
Purchases of Consumer Goods amounted to $622.43 million or a positive growth of 19.5 percent from $520.84 million in January 2012 while Special Transactions went down by 10.5 percent from $50.44 million to $45.14 million in January 2013. However, imports of both consumer goods and special transactions registered a positive growth of 7.9 percent and 34.4 percent, respectively, in terms of their volume of shipments compared to same month last year.
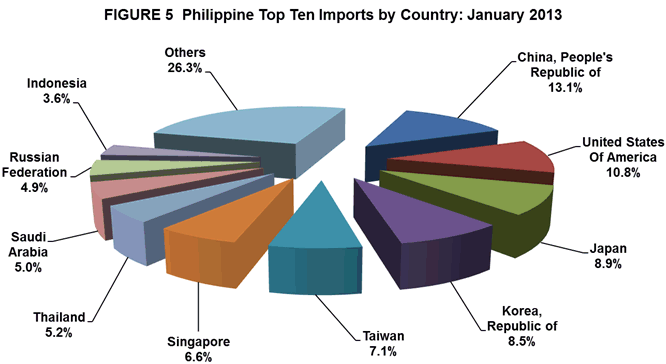
IMPORTS FROM THE PEOPLE’S REPUBLIC OF CHINA ACCOUNT 13.1 PERCENT
People’s Republic of China was the country’s biggest source of imports for January 2013 with 13.1 percent share of the total import bill, higher by 15.2 percent to $616.98 million from $535.63 million in January 2012. The increase in the inward purchases from China includes importation of other mineral fuels and lubricants, telecommunication equipment and non-metallic mineral manufacture. Exports to People’s Republic of China amounted to $422.06 million, yielding a two-way trade value of $1.039 billion and a trade deficit for PH of $194.93 million.
United States of America (USA) including Alaska and Hawaii was the second biggest source of imports with 10.8 percent share. Payments were recorded at $510.89 million, an increase of 10.4 percent from $462.84 million in January 2012. Commodities imported from USA were components/devices (semiconductors) such as wafers of discs and dice of any materials, cereals and cereal preparations like wheat, feeding stuffs for animals and dairy products. Revenue from PH’s exports to USA, on the other hand, reached $523.54 million, generating a total trade value of $1.034 billion and $12.66 million trade surplus for the Philippines.
Japan including Okinawa came third, accounting for 8.9 percent share of the total import bill in January 2013 with negative growth of 19.2 percent from $520.93 million to $420.86 million. Components/devices (semiconductors), land transport equipment and iron and steel were the recorded imported goods from Japan. Exports to Japan amounted to $769.04 million resulting to a total trade value of $1.190 billion and a trade surplus of $348.18 million.
Republic of Korea settled fourth accounting for 8.6 percent share of the total import bill in January 2013, increasing slightly by 0.4 percent to $403.76 million from $402.29 million during the same month in 2012. Commodities purchased from Korea in January 2013 were mineral fuels and lubricants and components/devices. Exports to Republic of Korea amounted to $564.72 million resulting to a total trade value of $968.48 million and a trade surplus of $160.97 million.
Fifth in rank was Taiwan, representing 7.1 percent of the total import bill in January 2013 and with import value amounting to $337.03 million. Mostly mineral, fuels and lubricants and components/devices (semiconductors) were among the highest imported goods from Taiwan in January 2013. Meanwhile, export receipts from Taiwan reached $134.11 million yielding a total trade value of $471.14 million and a trade deficit of $202.91 million.
Other major sources of imports for the month of January 2013 were Singapore, $309.63 million; Thailand $244.92 million; Saudi Arabia, $236.44 million; Russian Federation, $232.26 million with import products of crude petroleum and iron and steel; and Indonesia $169.25 million.
Payments for imports from the top ten sources for January 2013 amounted to $3.482 billion or 73.7 percent of the total.
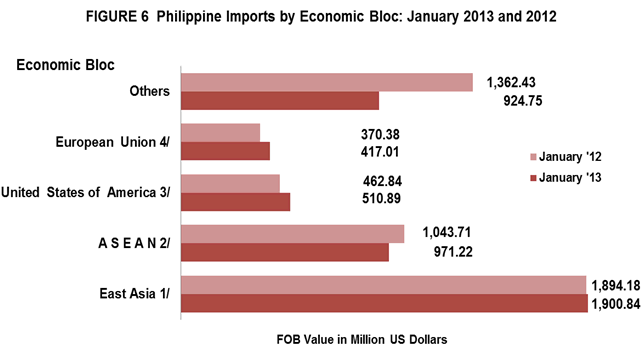
IMPORTS FROM EAST
Philippines total imports in January 2013 with East Asia (China, Hong Kong, Japan, Macau, Mongolia, North Korea, South Korea and Taiwan) accounted for 40.2 percent of the county’s total imports with total payments of $1.901 billion moving up slightly by 0.4 percent from January 2012 level of $1.894 billion. Total exports to member-countries of East Asia were valued at $2.220 billion, resulting to a total trade of $4.121 billion and a balance of trade in goods (BOT-G) surplus of $318.99 million.
Imports from ASEAN member-countries in January 2013, amounting to $971.22 million, contributed 20.6 percent share. It was lower by 7.0 percent from $1.044 billion registered in January 2012. Exports to ASEAN member-countries worth $582.55 million resulted to a total trade of $1.554 billion and a trade deficit of $388.67 million.
January 2013 imports from European Union were valued at $417.01 million while exports to member-countries of European Union were worth $438.36 million. These aggregated to total trade of $855.37 million and a trade surplus of $21.36 million.
Notes:
1/ - includes China, Hong Kong, Japan, Macau, Mongolia, N, Korea, S. Korea, Taiwan
2/ - includes Brunei Darussalam, Cambodia, Indonesia, Laos, Malaysia, Myanmar, Singapore, Thailand, Vietnam
3/ - includes Alaska and Hawaii
4/ - includes Austria, Belgium, Bulgaria, Cyprus, Czech Republic, Denmark, Estonia, Finland, France, Germany,
Greece, Hungary, Ireland, Italy, Latvia, Lithuania, Luxembourg, Malta, Netherlands, Poland, Portugal,
Romania, Slovakia, Slovenia, Spain, Sweden and UK Great Britain
Technical Notes:
- Adjustments on electronic import statistics are based on the transactions that pass through the Electronic to Mobile (e2m) of the Bureau of Customs (BOC).
- Starting with the 2007 Press Release, analysis and tables are based on the 2004 Philippine Standard Commodity Classification (PSCC) groupings. This is in compliance with NSCB Resolution No. 03, Series of 2005 entitled “Approving and Adopting the 2004 Philippine Standard Commodity Classification” by all concerned government agencies and instrumentalities.
CARMELITA N. ERICTA
Administrator
Industry and Trade Statistics Department
National Statistics Office
Manila, Philippines
| Attachment | Size |
|---|---|
|
|
6.37 KB |
|
|
12.09 KB |
|
|
13.16 KB |
|
|
6.63 KB |
|
|
6.79 KB |
|
|
7.58 KB |
|
|
7.21 KB |