
January to June total trade stands at $38.67 billion
Total external trade in goods for January to June 2004 amounted to $38.67 billion representing an increment of 7.8 percent from $35.872 billion during the same period of the previous year. Total foreign-made merchandise also grew by 7.2 percent to $19.938 billion from $18.608 billion. Likewise, exports recorded a year-on-year growth rate of 8.5 percent to aggregate dollar revenue of $18.734 billion from $17.264 billion a year ago. Balance of trade in goods (BOT-G) deficit for the Philippines reached $1.204 billion, lower compared to last year's deficit of $1.344 billion.
Figure 1A. Philippine Trade Performance in January - June :2003 and 2004
(F.O.B. Value in Million US Dollar)
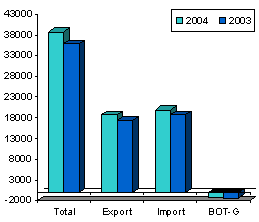
Figure 1B. Philippine Trade Performance in June :2003 - 2004
(F.O.B. Value in Million US Dollar)
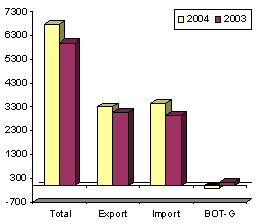
June imports up by 18.0 percent
Total merchandise trade for June 2004 picked up by 13.0 percent to $6.768 billion from $5.989 billion during the same period a year earlier. Dollar-inflow generated by exports amounted to $3.313 billion, or 8.2 percent higher than last year's $3.060 billion. Similarly, expenditures for imported goods went up by 18.0 percent to $3.455 billion from $2.929 billion. The Balance of Trade in goods (BOT-G) deficit for the Philippines was registered at $142 million, compared to last year's surplus at $132 million.
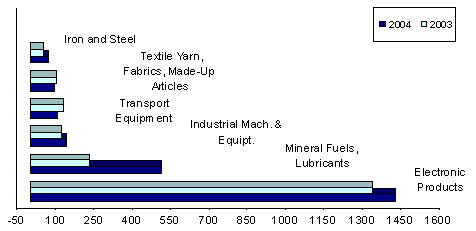
Electronic products account for 41.4 percent of import bill
Accounting for 41.4 percent of the total aggregate import bill, payments for electronic products amounted to $1.432 billion or 6.7 percent higher than last year's reported figure at $1.342 billion. Compared to the previous month's level, purchases rose by 1.3 percent from $1.413 billion.
Imports of mineral fuels, lubricants and related materials ranked second with 15.0 percent share. Expenditures at $517.54 million, registered by as much as 119.3 percent increase over the previous year's level which stood at $236.04 million.
Industrial machinery and equipment, the third top import was worth $146.13 million, or a 20.2 percent higher from $121.58 million in the previous year.
Transport equipment accounting for 3.1 percent of the total imports, ranked fourth as foreign bill amounted to $108.18 million, lower by 17.7 percent from last year's figure at $131.51 million.
Textile yarn, fabrics, made-up articles and related products, contributing 2.8 percent to the total bill, was RP's fifth top import for the month with payments placed at $96.66 million or a 7.8 percent drop than last year's $104.9 million.
Expenditures for iron and steel, with a 2.2 percent share to the aggregate bill, increased by 41.0 percent to $76.54 million from $54.29 million in June 2003.
Rounding up the list of the top imports for June 2004 were: telecommunication equipment and electrical machinery, $71.71 million; plastics in primary and non-primary forms, $67.36 million; cereals and cereal preparations, $62.0 million; and organic and inorganic chemical, $55.1 million.
Aggregate payment for the country's top ten imports for June 2004 amounted to $2.633 billion or 76.2 percent of the total bill.
Figure 2. Philippine Top Imports in June 2003 and 2004
(F.O.B. Value in Million US Dollar)
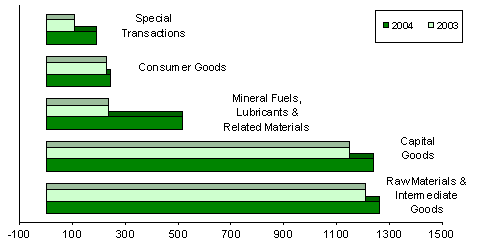
Raw materials and intermediate goods account for 36.6 percent of the total imports
Payments for raw materials and intermediate goods accounted for 36.6 percent as importation went up by 4.6 percent to $1.264 billion from last year's reported figure of $1.209 billion. Semi-processed raw materials got the biggest share with a 32.4 percent and valued at $1.120 billion.
Capital goods comprising 35.8 percent of the total imports improved by 7.8 percent year-on-year to $1.238 billion from $1.149 billion. The major share went to telecommunication equipment and electrical machinery with a 20.9 percent share of the total imports and billed at $722.84 million.
Expenditures for mineral fuels, lubricants and related materials increased by 119.3 percent to $517.54 million from $236.04 million during the same period of 2003.
Purchases of consumer goods priced at $246.11 million grew by 7.4 percent from $229.13 million in June 2003, while special transactions rose by 79.4 percent to $189.46 million from $105.62 million.
Figure 3. Philippine Imports by Major Type of Goods in June: 2003 and 2004
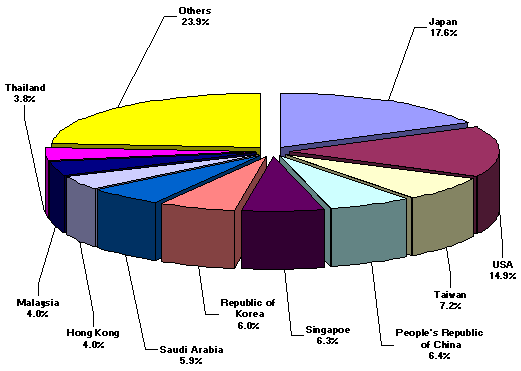
Japan corners 17.6 percent of june import bill
Imports from Japan accounting for 17.6 percent of the total import bill, declined by 3.6 percent to $606.92 million from $629.65 million during the same period a year earlier. On the other hand, exports to Japan, amounted to $678.86 million yielding a two-way trade value of $1.286 billion and a trade surplus for RP placed at $71.94 million.
United States, the country's second biggest source of imports with a 14.9 percent share, reported shipments valued at $515.67 million against exports earnings of $537.65 million. Total trade amounted to $1.053 billion, with a trade surplus for the Philippines recorded at $21.98 million.
Taiwan, followed as RP's third biggest source of imports. With payments worth $248.46 million, imports moved up by 86.9 percent from $132.96 million, while revenue from RP's exports reached $188.77 million resulting to a total trade value of $437.23 million and a $59.69 million deficit for Philippines.
Other major sources of imports for the month of June were: People's Republic of China, $222.39 million; Singapore, $217.48 million; Republic of Korea, $208.06 million; Saudi Arabia, $202.46 million; Hong Kong, $139.80 million; Malaysia, $137.37 million; and Thailand, $130.18 million.
Payments for imports from the top ten sources for the month amounted to $2.629 billion or 76.1 percent of the total.
Figure 4. Philippine Imports by Country in June: 2004
As of press time 27 out of 61,546 export documents and 45 out of 75,176 import documents are still expected from the ports.
|
(Sgd.) CARMELITA N. ERICTA |
Source: National Statistics Office
Manila, Philippines