
|
||||||||||||||||||||||||||||||||||||||||||||||||
r - revised
|
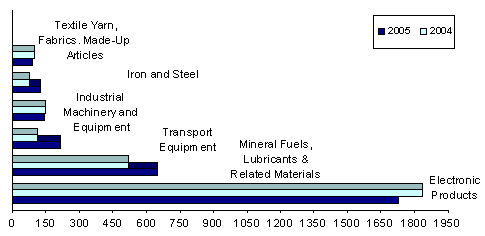
Top 10 Philippine Imports from All Countries: June 2005 |
|||
|
Gainers |
Losers |
||
|
Transport Equipment |
100.7 |
Textile Yarn, Fabrics, Made-Up Articles and Related Products |
-6.6 |
|
Iron and Steel |
66.4 |
Electronic Products |
-5.7 |
|
Mineral Fuels, Lubricants and Related Materials |
25.5 |
Industrial Machinery and Equipment |
-0.9 |
|
Cereals and Cereal Preparations |
22.3 |
|
|
|
Organic and Inorganic Chemical |
5.2 |
|
|
|
Telecommunication Equipment and Electrical Machinery |
1.3 |
|
|
|
Plastics in Primary and Non-Primary Forms |
1.0 |
|
|
January to June total trade stands at $40.921 billion
Total external trade in goods for January to June 2005 amounted to $40.921 billion, an increase of 0.7 percent from $40.628 billion during the same period a year earlier. Likewise, total foreign-made merchandise fell by 1.5 percent to $21.524 billion from $21.844 billion.On the other hand, exports registered a year-on-year growth of 3.3 percent to aggregate dollar revenue of $19.397 billion from $18.784 billion last year. Balance of trade in goods (BOT-G) deficit for the Philippines reached $2.127 billion lower compared to last year’s deficit of $3.060 billion.
Figure 1A. Philippine Trade Performance in January - June :2004 and 2005
(F.O.B. Value in Million US Dollar)
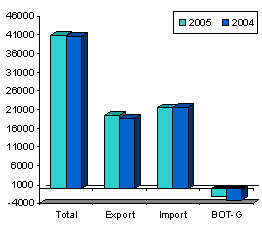
Figure 1B. Philippine Trade Performance in June :2004 - 2005
(F.O.B. Value in Million US Dollar)
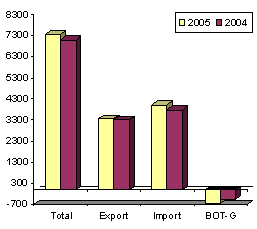
June imports register 6.0 percent increase
Total merchandise trade for June 2005 slightly increased by 3.7 percent to $7.357 billion from $7.096 billion during the same period of the previous year. Dollar-inflow generated by exports amounted to $3.352 billion, or 1.0 percent higher than last year’s $3.318 billion. Similarly, expenditures for imported goods advanced by 6.0 percent to $4.005 billion from $3.778 billion. The balance of trade in goods (BOT-G) registered a deficit of $653 million, higher compared to last year’s deficit of $460 million.
Electronic products account for 43.2 percent of import bill
Accounting for 43.2 percent of the total aggregate import bill, payments for electronic products amounted to $1.731 billion or a decline of 5.7 percent over last year’s figure of $1.836 billion. Compared to the previous month’s level, purchases grew by 7.4 percent from $1.613 billion.
Imports of mineral fuels, lubricants and related materials in June ranked second with 16.2 percent share. Expenditures at $649.67 million, registered a 25.5 percent growth over the previous year’s level of $517.53 million as world prices of crude oil went up.
Transport equipment, the third top import was worth $217.11 million, or an increase of 100.7 percent from $108.19 million a year ago. This was brought about by importations made on components, parts and accessories of airplanes and motor vehicles.
Industrial machinery and equipment, contributing 3.6 percent to the total bill, was RP’s fourth top import for the month with payments at $144.82 million or a drop of 0.9 percent from last year’s $146.17 million.
Iron and steel, accounting for 3.2 percent of the total imports, ranked fifth as it increased by 66.4 percent with foreign bill amounting to $127.59 million from $76.66 million last year due to higher value in the importation of semi-finished product of alloy and flat rolled products of steel.
Expenditures for textile yarn, fabrics, made-up articles and related products, with a 2.3 percent share, fell by 6.6 percent to $90.16 million from $96.51 million in June 2004.
Rounding up the list of the top imports for June 2005 were cereals and cereal preparation, $75.82 million, where higher value in the importation of rice and corn contributed the growth of 22.3 percent. Telecommunication equipment and electrical machinery, $72.92 million; plastics in primary and non-primary forms, $68.02 million; and organic and inorganic chemicals, $58.0 million. Higher importation of ethylene recorded during the month, primarily brought about the 5.2 percent increase in organic and inorganic chemicals.
Aggregate payment for the country’s top ten imports for June 2005 reached $3.235 billion or 80.8 percent of the total bill.
Figure 2. Philippine Top Imports in June 2004 and 2005
(F.O.B. Value in Million US Dollar)
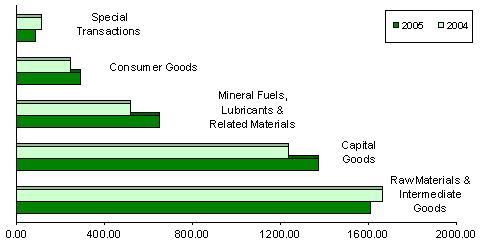
Raw materials and intermediate goods account for 40.2 percent of the total imports
Payments in June for raw materials and intermediate goods accounted for 40.2 percent share as importation dropped by 3.5 percent to $1.609 billion from last year’s figure of $1.668 billion. Semi-processed raw materials got the major share of 37.0 percent and valued at $1.480 billion.
Capital goods comprising 34.3 percent of the total imports, rose by 10.8 percent year-on-year to $1.372 billion from $1.238 billion. The biggest share went to telecommunication equipment and electrical machinery with an 18.1 percent share of the total imports and billed at $723.94 million.
Expenditures for mineral fuels, lubricants and related materials gained by 25.5 percent to $649.67 million from $517.53 million during the same period of 2004.
Purchases of consumer goods, amounted to $290.19 million, a rise of 18.1 percent from $245.82 million in June 2004, while special transactions decreased by 22.7 percent to $84.14 million from $108.80 million.
Figure 3. Philippine Imports by Major Type of Goods in June: 2004 and 2005
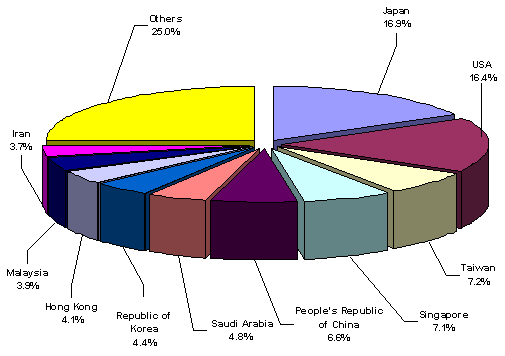
Japan corners 16.9 percent of june import bill
Imports from Japan accounting for 16.9 percent of the total import bill, grew by 7.1 percent to $678.39 million from $633.64 million during the same period of 2004. Exports to Japan, amounted to $515.82 million yielding a two-way trade value of $1.170 billion and a trade deficit for RP placed at $138.85 million.
United States, the country’s second biggest source of imports for June with a 16.4 percent share, reported shipments billed at $654.68 million against exports earnings of $569.75 million. Total trade amounted to $1.248 billion, with a trade deficit registered at $108.64 million.
Taiwan followed as the third biggest source of imports. With payments worth $286.52 million, imports went up by 5.1 percent from $272.68 million, while revenue from RP’s exports reached $151.18 million resulting to a total trade value of $437.70 million and a $135.34 million deficit for Philippines.
Other major sources of imports for the month of June were Singapore, $285.73 million; People’s Republic of China, $264.07 million; Saudi Arabia, $190.53 million; Republic of Korea, $175.93 million; Hong Kong, $164.47 million; Malaysia, $155.42 million; and Iran, $148.69 million.
Payments for imports from the top ten sources for the month amounted to $3.004 billion or 75.0 percent of the total.
Figure 4. Philippine Imports by Country in June: 2005
As of press time, 26 out of 56,257 export documents and 47 out of 75,200 import documents are still expected from the ports.
|
(Sgd.) CARMELITA N. ERICTA |
* Export figures do not include transactions that passed thru AEDS at Subic. The NSCB approved interim methodology for the revision of electronics import statistics was already applied to the January to June import figures.
Source: National Statistics Office
Manila, Philippines
| Attachment | Size |
|---|---|
|
|
7.3 KB |
|
|
5.43 KB |
|
|
9.3 KB |
|
|
8.63 KB |
|
|
12.5 KB |
|
|
10.31 KB |
|
|
7.4 KB |
|
|
6.43 KB |