External Trade Performance June 2008 (Preliminary)
| |||||||||||||||||||||||||||||||||||||||||||||||
| |||||||||||||||||||||||||||||||||||||||||||||||
r - revised
Top 10 Philippine Imports from All Countries: June 2008 | |||
Gainers | Losers | ||
| Fertilizers, Manufactured | 293.1 | Textile Yarn, Fabrics, Made-up Articles and Related Products | -29.4 |
| Cereals and Cereal Preparations | 162.7 | Electronic Products | -20.3 |
| Mineral Fuels, Lubricants and Related Materials | 75.7 |
| |
| Organic and Inorganic Chemicals | 36.0 |
|
|
| Transport Equipment | 34.9 |
| |
| Iron and Steel | 34.9 |
| |
| Plastics in Primary and Non-Primary Forms | 34.3 |
| |
| Industrial Machinery and Equipment | 2.0 |
| |
JANUARY TO JUNE 2008 TOTAL TRADE STANDS AT $55.130 BILLION
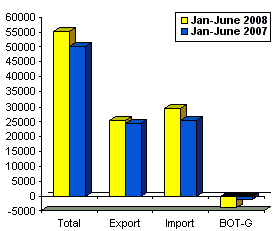
Total external trade in goods for January to June 2008 reached $55.130 billion, a 10.0 percent increment from $50.106 billion during the first semester of 2007. This is due to the 15.8 percent growth of the total imports to $29.532 billion from $25.506 billion during the first semester of 2007. Meanwhile, total exports grew a modest growth of 4.1 percent for January to June 2008 to aggregate dollar revenue of $25.598 billion from $24.600 billion in the same period last year. Balance of trade in goods (BOT-G) during the first semester of 2008 registered a deficit of $3.934 billion from $906.00 million deficit in the same period last year.
Figure 1A Philippine Trade Performance in January - June : 2007 and 2008
(F.O.B. Value in Million US Dollar)

Figure 1B Philippine Trade Performance in June : 2007 and 2008
(F.O.B. Value in Million US Dollar)

JUNE 2008 IMPORTS UP BY 12.7 PERCENT
Total merchandise trade for June 2008 rose by 10.9 percent to $9.818 billion from $8.854 billion in June 2007. Dollar-inflow generated by exports in June 2008 reached $4.513 billion, or 8.8 percent higher from last year’s $4.147 billion. The country’s merchandise imports, on the other hand, continued its growth by 12.7 percent to $5.305 billion from $4.707 billion in June 2007, which could be due to the increase in the inward shipments of crude petroleum oil and rice. The balance of trade in goods (BOT-G) in June 2008 recorded a deficit of $791.00 million from $559.00 million deficit in the same period last year.
ELECTRONIC PRODUCTS ACCOUNT FOR 32.9 PERCENT OF IMPORT BILL
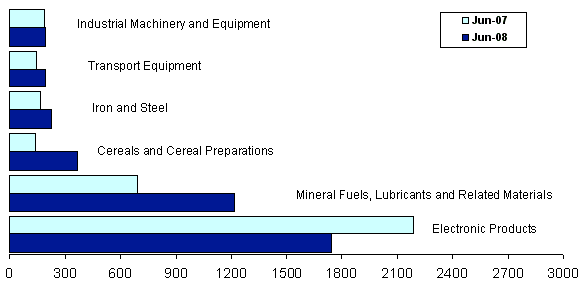
Accounting for 32.9 percent of the aggregate import bill, payments for Electronic Products amounted to $1.743 billion fell by 20.3 percent over last year's figure of $2.187 billion. However, payments forElectronic Products increased by 17.3 percent from $1.487 billion recorded in May 2008. Among the major groups of electronic products, Components/Devices (Semiconductors) had the biggest share of 25.3 percent, down by 24.1 percent to $1.340 billion from $1.766 billion in June 2007.
Imports of Mineral Fuels, Lubricants and Related Materials in June 2008 ranked second with a 22.9 percent share and posted a growth of 75.7 percent to $1.216 billion over the previous year’s level of $691.98 million.
Cereals and Cereal Preparations, contributing 6.9 percent to the total import bill, was the RP’s third top import for the month with payments placed at $367.43 million from last year’s $139.88 million or an increase of 162.7 percent.
Iron and Steel, accounting for a 4.3 percent of the total imports, ranked fourth as foreign bill amounted to $228.44 million, up by 34.9 percent from $169.40 million last year.
Transport Equipment ranked fifth recorded a share of 3.7 percent at $195.80 million worth of imports, went up by 34.9 percent from its year ago level of $145.11 million.
Industrial Machinery and Equipment, ranked sixth comprising 3.7 percent of the total imports registered $194.23 million worth of imports; up by 2.0 percent from its year ago level of $190.39 million.
Rounding up the list of the top ten imports for June 2008 were Organic and Inorganic Chemicals,$112.74 million; Plastics in Primary and Non-Primary Forms with $108.97 million worth of imports;Manufactured Fertilizers, $101.90 million; and Textile Yarn, Fabrics, Made-Up Articles and Related Products, $76.85 million.
Aggregate payment for the country’s top ten imports for June 2008 reached $4.345 billion or 81.9 percent of the total import bill.
Figure 2 Philippine Top Six Imports in June : 2007 and 2008
(F.O.B. Value in Million US Dollar)

RAW MATERIALS AND INTERMEDIATE GOODS ACCOUNT FOR 37.4 PERCENT OF THE TOTAL IMPORTS
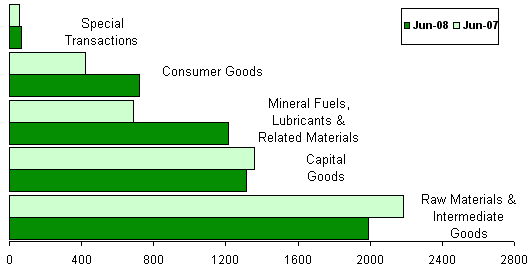
Accounting for 37.4 percent of the total imports, payments in June 2008 for Raw Materials and Intermediate Goods amounted to $1.986 billion or a 9.0 percent decline over last year's figure of $2.181 billion. However, compared to the previous month’s level, purchases went up by 16.3 percent from $1.708 billion. Semi-Processed Raw Materials had the biggest share of 34.7 percent and valued at $1.838 billion.
Capital Goods, which comprised 24.8 percent of the total imports, went down by 3.2 percent year-on-year, to $1.314 billion from $1.358 billion. The major share went to Telecommunication Equipment and Electrical Machinery with a 13.6 percent share of the total imports in June 2008 and billed at $720.46 million.
Mineral Fuels, Lubricants and Related Materials with a 22.9 percent share, increased by 75.7 percent to $1.216 billion from $691.98 million in June 2007.
Purchases of Consumer Goods amounted to $721.80 million or an increase of 70.9 percent from $422.39 million in June 2007, while Special Transactions likewise grew by 26.5 percent to $67.19 million from $53.11 million in June 2007.
Figure 3 Philippine Imports by Major Type of Goods in June: 2007 and 2008

JAPAN CORNERS 11.6 PERCENT OF JUNE 2008 IMPORT BILL
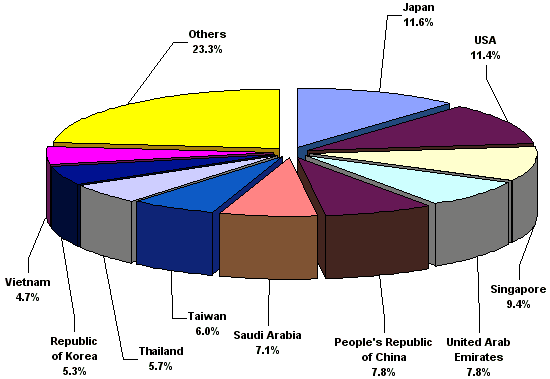
Japan was the country’s biggest source of imports for June 2008 with an 11.6 percent share of the total import bill rose by 17.3 percent to $617.67 million from $526.74 million in June 2007. Exports toJapan amounted to $661.24 million, yielding a two-way trade value of $1.279 billion and a trade surplus for RP at $43.57 million.
United States of America (USA) followed as the second biggest source of imports with an 11.4 percent share, recording payments worth $602.75 million, fell by 10.4 percent from $672.77 million in June 2007. Revenue from RP’s exports to United States of America (USA), on the other hand, reached $702.69 million, generating a total trade value of $1.305 billion and a $99.93 million trade surplus for the Philippines.
Singapore came third, accounting for a 9.4 percent share of the total import bill in June 2008, down by 21.4 percent to $499.25 million from $635.39 million during the same month in 2007. Exports toSingapore amounted to $246.28 million resulting to a total trade value of $745.53 million and a trade deficit of $252.97 million.
Other major sources of imports for the month of June 2008 were United Arab Emirates, $413.86 million; People’s Republic of China, $412.49 million; Saudi Arabia, $376.06 million; Taiwan, $316.40 million; Thailand, $300.76 million; Republic of Korea, $279.21 million; and Vietnam, $248.81 million.
Payments for imports from the top ten sources for June 2008 amounted to $4.067 billion or 76.7 percent of the total.
Figure 4 Philippine Imports by Country in June: 2008

Technical Notes:
1. Adjustments on electronic import statistics are based on the transactions that pass through the Automated Cargo Operating System (ACOS) of the Bureau of Customs (BOC).
2. Starting on January 2007 Press Release, analysis and tables are based on 2004 Philippine Standard Commodity Classification (PSCC) groupings. This is in compliance with NSCB Resolution No. 03, Series of 2005 entitled Approving and Adopting the 2004 Philippine Standard Commodity Classification by all concerned government agencies and instrumentalities.
(Sgd.) CARMELITA N. ERICTA |
Source: Foreign Trade Statistics Section
Industry and Trade Statistics Department
National Statistics Office
Manila, Philippines
