
| |||||||||||||||||||||||||||||||||||||||
r - revised
Top 10 Philippine Imports from All Countries: June 2009 | |||
Gainer | Losers | ||
Medicinal and Pharmaceutical Products | 9.0 | Iron and Steel | -67.4 |
|
| Plastics in Primary and Non-Primary Forms | -46.2 |
|
| Industrial Machinery and Equipment | -31.9 |
|
| Mineral Fuels, Lubricants and Related Materials | -30.6 |
|
| Telecommunication Equipment and Electrical Machinery | -23.1 |
|
| Electronic Products | -20.3 |
|
| Organic and Inorganic Chemicals | -17.6 |
|
| Cereals and Cereal Preparations | -5.3 |
|
| Transport Equipment | -1.4 |
JANUARY TO JUNE TOTAL TRADE VALUED AT $37.586 BILLION
Total external trade in goods for January to June 2009 reached $37.586 billion, exhibiting a 31.9 percent decline from $55.188 billion recorded during the same period in 2008. This was attributed to the 31.1 percent decrease of total imports to $20.365 billion from $29.565 billion reported in the first six months of 2008. Similarly, total exports went down by 32.8 percent to $17.221 billion from $25.623 billion posted in January to June 2008. Thus, the balance of trade in goods (BOT-G) for the Philippines under review registered a $3.143 billion deficit from $3.943 billion deficit in the same 6-month period last year.
Figure 1A Philippine Trade Performance in January - June : 2009 and 2008
(F.O.B. Value in Million US Dollars)
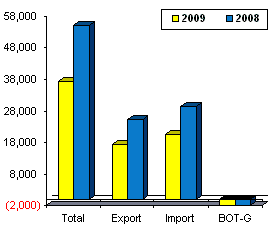
Figure 1B Philippine Trade Performance in June : 2009 and 2008
(F.O.B. Value in Million US Dollars)
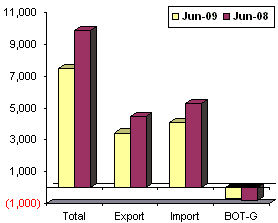
JUNE 2009 IMPORTS DROPPED BY 22.8 PERCENT
Total merchandise trade for June 2008 contracted by 23.7 percent to $7.514 billion from $9.849 billion in June 2008. Total exports amounted to $3.406 billion or 24.8 percent lower from last years $4.527 billion. Similarly, the countrys total merchandise imports for June 2009 plunged by 22.8 percent to $4.108 billion from $5.322 billion in June 2008. However, month-on-month, it appreciated by 13.6 percent from $3.617 billion recorded in May 2009.
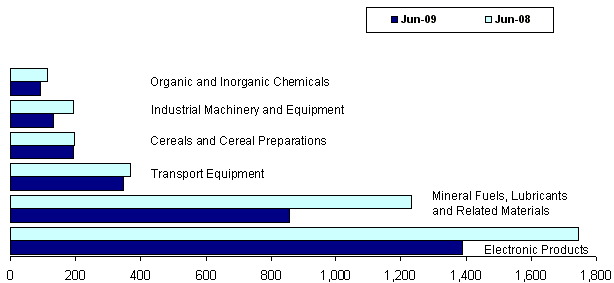
ELECTRONIC PRODUCTS ACCOUNTED FOR 33.8 PERCENT OF IMPORT BILL
Accounting for 33.8 percent of the aggregate import bill, payments for Electronic Products (including consigned and direct importation using the expanded coverage of electronic products) in June 2009 amounted to $1.390 billion. It went down to 20.3 percent over last year's figure of $1.743 billion. This was due to the 21.2 percent decrease in Components/Devices (Semiconductors) which comprised the biggest share of 25.7 percent among the major groups of electronic products. However, electronic products rose by 6.8 percent month-on-month from $1.301 billion in May 2009.
Imports of Mineral Fuels, Lubricants and Related Materials comprising 20.8 percent of the total imports in June 2009 ranked second, valued at $855.16 million over the previous years level of $1.233 billion.
Cereals and Cereal Preparations, amounting to $347.58 million was the RPs third top import for the month with 8.5 percent share to total imports and showed a negative annual growth of 5.3 percent.
Contributing 4.7 percent to the total import bill and RPs fourth top imports in June 2009 was Transport Equipment with payments placed at $193.16 million. The amount diminished by 1.4 percent from last years recorded value of $195.80 million.
Fifth in rank and with 3.2 percent share, Industrial Machinery and Equipment registered $132.52 million worth of imports, lower by 31.9 percent from its year ago level of $194.52 million.
Organic and Inorganic Chemicals ranked sixth, representing 2.3 percent of the total imports recorded $92.99 million worth of imports which decreased by 17.6 percent from its year ago level of $112.90 million.
Rounding up the list of the top ten imports for June 2009 were Iron and Steel, accounting for $74.44 million and showed the highest annual negative growth of 67.4 percent among the top ten imports; Medicinal and Pharmaceutical Products amounting to $60.42 million and the only commodity group that showed a positive annual increase of 9.0 percent; Plastics in Primary and Non-Primary Formsvalued at $58.57 million fell by 46.2 percent; and Telecommunication Equipment and Electrical Machinery (including telecommunications and sound recording and reproducing apparatus and equipment) worth $54.97 million surged by 23.1 percent.
Aggregate payment for the countrys top ten imports for June 2009 reached $3.259 billion or 79.4 percent of the total import bill.
Figure 2 Philippine Top Six Imports in June : 2009 and 2008
(F.O.B. Value in Million US Dollars)
RAW MATERIALS AND INTERMEDIATE GOODS ACCOUNTED FOR 36.3 PERCENT OF THE TOTAL IMPORTS
Accounting for 36.3 percent of the total imports, payments in June 2009 for Raw Materials and Intermediate Goods amounted to $1.493 billion or 24.8 percent decline over last year's figure of $1.985 billion. Compared to the previous months level, purchases went up by 3.8 percent from $1.438 billion.Semi-Processed Raw Materials having the biggest share of 31.1 percent and valued at $1.279 billion decreased by 30.5 percent from $1.838 billion level a year ago.
Capital Goods, contributing 27.2 percent to the total imports, plummeted by 15.1 percent year-on-year to $1.117 billion from $1.315 billion. Similarly, Mineral Fuels, Lubricants and Related Materials with 20.8 percent share, declined by 30.6 percent to $855.16 million from $1.233 billion in June 2008.
Purchases of Consumer Goods amounted to $578.11 million or a negative growth of 19.9 percent from $721.90 million in June 2008, while Special Transactions dropped by 4.2 percent to $64.48 million from $67.32 million in June 2008.
Figure 3 Philippine Imports by Major Type of Goods in June : 2009 and 2008
(F.O.B. Value in Million US Dollars)

JAPAN ACCOUNTED FOR 11.9 PERCENT OF IMPORT BILL
Japan (including Okinawa) was the countrys biggest source of imports for June 2009 with 11.9 percent share, recorded payments worth $486.92 million, a decline of 21.2 percent year on year from $617.57 million. Revenue from the countrys exports to Japan, on the other hand, reached $578.64 million, generating a total trade value of $1.066 billion and $91.73 million trade surplus for the Philippines.
United States of America (USA) which includes Alaska and Hawaii with 11.2 percent share of the total import bill amounting to $458.00 million followed as the second biggest source of imports for June 2009. This value is lower by 24.0 percent from $602.58 million in June 2008. Exports to USA amounted to $607.96 million, yielding a two-way trade value of $1.066 billion and a trade surplus for RP of $149.96 million.
Peoples Republic of China, came third, accounting for 7.8 percent share of the total import bill in June 2009 went down by 22.5 percent to $319.74 million from $412.55 million during the same month in 2008. Exports to Peoples Republic of China amounted to $274.31 million resulting to a total trade value of $594.06 million and a trade deficit of $45.43 million.
Rank fourth in June 2009 and with 7.8 percent share was Taiwan valued at $319.12 million. This amount slightly grew by 0.9 percent from $316.39 million posted in June 2008. Exports to Taiwan amounted to $118.18 million resulting to a total trade value of $437.31 million and a trade deficit of $200.94 million.
Fifth in rank is Singapore, representing 7.2 percent of the total import bill in June 2009, amounting to $294.16 million. Meanwhile, export receipts from Singapore in June 2009 reached $248.74 million yielding a total trade value of $542.90 million and a trade deficit of $45.42 million.
Other major sources of imports for the month of June 2009 were Saudi Arabia, $284.37 million;Republic of Korea, $254.04 million; Vietnam, $235.32 million; Thailand, $218.45 million; andMalaysia, $186.32 million.
Payments for imports from the top ten sources for June 2009 amounted to $3.056 billion or 74.4 percent of the total.
Figure 4 Philippine Imports by Country in June : 2009

IMPORTS FROM EASTERN ASIA WORTH $1.510 BILLION
Philippines total imports in June 2009 with Eastern Asia which includes China, Hong Kong, Macau, Japan, Taiwan, North Korea, South Korea and Mongolia grossed to $1.509 billion or 36.8 percent. Exports to member-countries of Eastern Asia was valued at $1.402 billion, resulting to a total trade of $2.911 billion and a balance of trade in goods (BOT-G) deficit of $108.29 million.
June 2009 Imports to ASEAN member-countries amounted to $1.102 billion or 26.8 percent. Exports toASEAN member-countries worth $520.17 million, resulting to a total trade of $1.622 billion and trade deficit of $581.68 million.
Imports to European Union in June 2009 valued at $269.35 million while exports to member-countries ofEuropean Union was worth $645.28 million. This aggregate to total trade of $914.63 million and a trade surplus of $375.93 million.
Figure 5 Philippine Imports by Selected Economic Bloc in June : 2009
(F.O.B. Value in Million US Dollars)

Technical Notes:
1. Adjustments on electronic import statistics are based on the transactions that pass through the Automated Cargo Operating System (ACOS) of the Bureau of Customs (BOC).
2. Starting with the January 2007 Press Release, analysis and tables are based on the 2004 Philippine Standard Commodity Classification (PSCC) groupings. This is in compliance with NSCB Resolution No. 03, Series of 2005 entitled "Approving and Adopting the 2004 Philippine Standard Commodity Classification" by all concerned government agencies and instrumentalities.
(Sgd.) CARMELITA N. ERICTA |
Source: Foreign Trade Statistics Section
Industry and Trade Statistics Department
National Statistics Office
Manila, Philippines