
EXTERNAL TRADE PERFORMANCE
June 2012
(Preliminary)
p-preliminary
r-revised

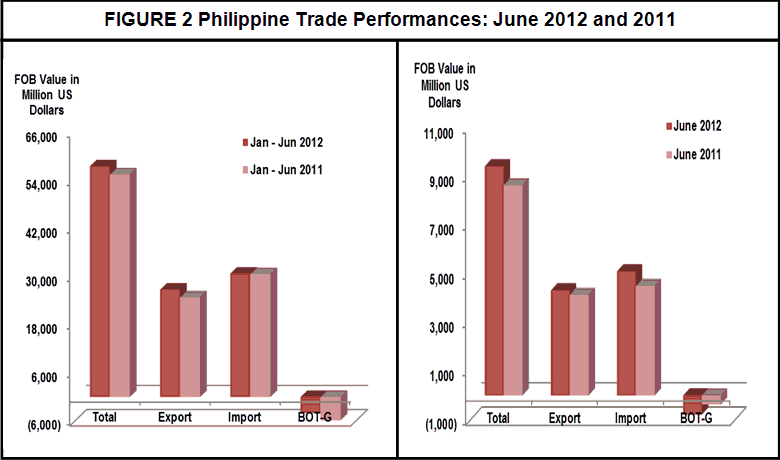
JUNE 2012 TOTAL TRADE STANDS AT $9.415 BILLION
Total external trade in goods for June 2012 reached $9.415 billion, representing a 9.0 percent increase from $8.639 billion recorded during the same month in 2011. This was due to the 13.3 percent increase in total imports from $4.504 billion in June 2011 to $5.101 billion. Similarly, exports increased by 4.3 percent from $4.135 billion in the same month a year ago to $4.314 billion. Thus, the balance of trade in goods (BOT-G) for the Philippines in June 2012 registered a deficit of $787 million from $369 million deficit in the same period last year.
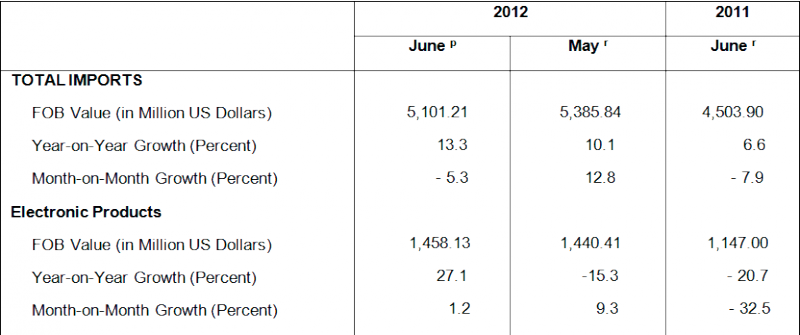
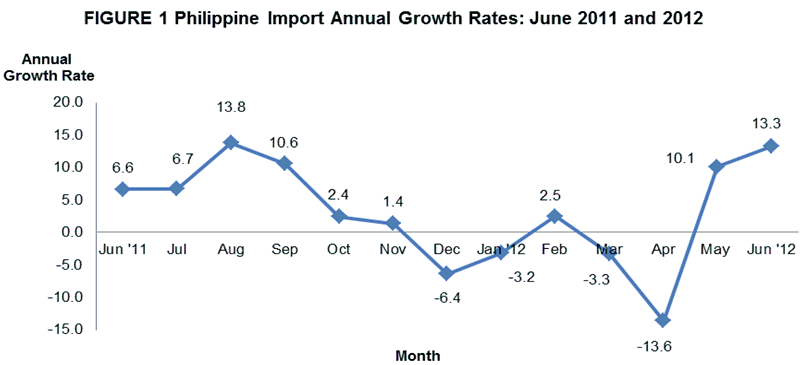
JUNE 2012 IMPORTS UP BY13.3 PERCENT
The country’s total merchandise imports for June 2012 went up by 13.3 percent to $5.101 billion from $4.504 billion. However, it decreased by 5.3 percent compared to previous month’s level to $5.386 billion. On the other hand, aggregate imports slightly went up by 0.4 percent to $30.761 billion value in the first semester in 2012 from $30.653 billion for the same period in 2011.
ELECTRONIC PRODUCTS ACCOUNT FOR 28.6 PERCENT OF IMPORT BILL
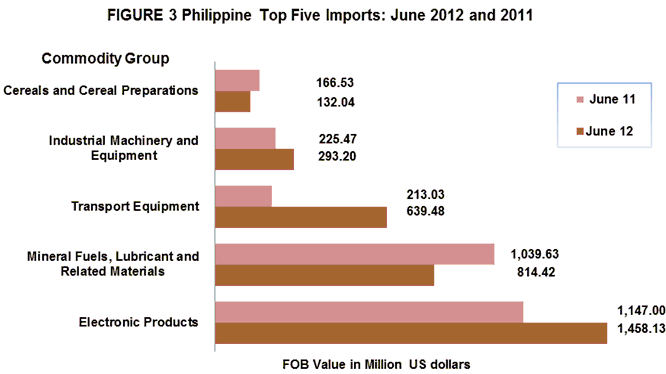
Accounting for 28.6 percent of the aggregate import bill, payments for Electronic Products (including consigned and direct importation using the expanded coverage of electronic products) expanded by 27.1 percent to reported value of $1.458 billion from $1.147 billion in June 2011. Similarly, it went up by 1.2 percent from $1.440 billion recorded in May 2012. Among the major groups of electronic products, Components/Devices (Semiconductors) having the biggest share of 22.3 percent increased by 33.0 percent to $1.139 billion from $856.51 billion.
Import bill payments for Mineral Fuels, Lubricants and Related Materials ranked second among the top ten imports with 16.0 percent share to total imports. The annual growth rate went down by 21.7 percent from $1.040 billion to $814.42 million, despite the 3.8 percent increase in volume of inward shipments. The contraction in value may be attributed to the lowering of oil prices in the global market.
Transport Equipment was the PH’s third top import for the month with 12.5 percent share to total imports valued at $639.48 million. It posted the highest year on year change of 200.2 percent among the top ten imports to $639.48 million from $213.03 million from previous year’s value. The expansion was brought about by the aircraft importation and higher import purchases of motor vehicles and its parts and accessories.
Industrial Machinery and Equipment contributing about 5.7 percent to the total import bill was the fourth top import for the month amounting to $293.20 million. Compared to last year’s amount of $225.47 million, it grew by 30.0 percent. Similarly, volume purchases also went up by 31.9 percent from the same period last year.
Fifth in rank and with 2.6 percent share to the total imports was Cereals and Cereal Preparations, recorded $132.04 million worth of imports from its year ago level of $166.53 million. An annual negative growth of 20.7 percent was shown because of the 12.0 percent decrease in volume of imports compared to June 2011.
Rounding up the list of the top ten imports for June 2012 were Plastics in Primary and Non-Primary Forms, $126.59 million; Iron and Steel, $113.59 million; Organic and Inorganic Chemicals, $110.54 million; Telecommunication Equipment and Electrical Machinery, $105.75 million; and Medicinal and Pharmaceutical Products, $72.04 million.
Aggregate payment for the country’s top ten imports for June 2012 reached $3.866 billion or 75.8 percent of the total import bill.
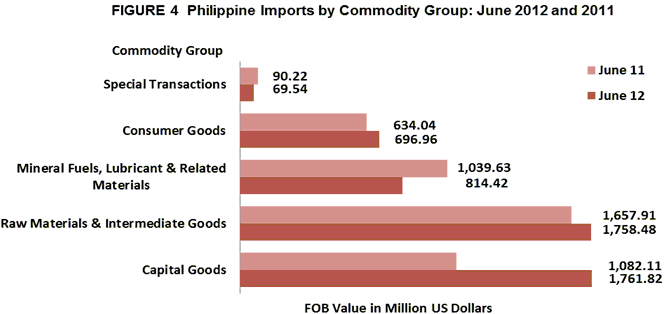
CAPITAL GOODS ACCOUNT FOR 34.5 PERCENT OF THE TOTAL IMPORTS
Capital Goods, which comprised 34.5 percent of the total imports in June 2012, year-on-year change went up by 62.8 percent from $1.082 billion to $1.762 billion. The growth was brought about by the inward shipment of aircrafts, ships and boats that registered more than a thousand growth rate compared to last year’s shipment.
Also accounting for 34.5 percent of the total imports, payments for Raw Materials and Intermediate Goods amounted to $1.758 billion or 6.1 percent increment over last year's figure of $1.658 billion. Compared to the previous month’s level, purchases went down by 10.3 percent from $1.960 billion. Semi-Processed Raw Materials had the biggest share of 32.2 percent and valued at $1.644 billion. Increase in the import bill can be accounted for by 140.5 percent increase in volume of purchases for embroideries.
Purchases of Consumer Goods amounted to $696.96 million or a positive growth of 9.9 percent from $634.04 million in June 2011. The increase was brought about by the 60.3 percent increase in purchases of passenger car and motorized cycle.
Imports of commodities under Special Transactions valued at $69.54 million dropped by 22.9 percent from $90.22 million recorded in June 2011.
IMPORTS FROM UNITED STATES OF AMERICA ACCOUNT FOR 15.7 PERCENT
United States of America (USA) including Alaska and Hawaii was the country’s biggest source of imports in June 2012 with 15.7 percent share. Payments were recorded at $803.42 million, an increase of 74.7 percent from $460.02 million in June 2011. Revenue from PH’s exports to USA, on the other hand, reached $674.20 million, generating a total trade value of $1.478 billion and $129.22 million trade deficit for the Philippines. The increase in the inward purchases from USA was based on imported commodities like the aircraft and electronic products.
Japan including Okinawa was the second top source of imports with 11.9 percent share to the total import bill amounting to $608.93 million, higher by 46.0 percent from $417.22 million in June 2011. Exports to Japan amounted to $705.82 million, yielding a two-way trade value of $1.315 billion and a trade surplus for PH of $96.89 million.
People’s Republic of China came third, accounting for 10.7 percent share of the total import bill in June 2012 with positive growth of 16.0 percent from $470.39 million to $545.76 million. Exports to People’s Republic of China amounted to $534.91 million resulting to a total trade value of $1.081 billion and a trade deficit of $10.86 million.
Taiwan ranked fourth among the top sources of imports for the country accounting for 6.7 percent share of the total import bill in June 2012. It increased by 13.9 percent from $298.38 million to $340.00 million. On the other hand, exports to Taiwan amounted to $173.26 million resulting to a total trade value of $513.25 million and a trade deficit of $166.74 million.
Fifth in rank was Republic of Korea, representing 6.6 percent of the total import bill in June 2012 or an increase of 26.7 percent to $334.98 million from $264.38 million in the same month last year. Exports to Republic of Korea amounted to $231.12 million resulting to a total trade value of $566.11 million and a trade deficit of $103.86 million.
Other major sources of imports for the month of June 2012 were Singapore, $323.14 million; Thailand, $320.21 million; Saudi Arabia, $241.71 million; Indonesia, $235.01 million; and Malaysia $188.15 million.
Payments for imports from the top ten sources for June 2012 amounted to $3.941 billion or 77.3 percent of the total.

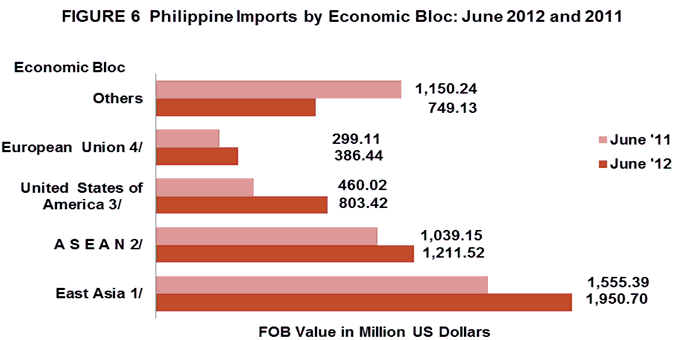
IMPORTS FROM EAST
Philippines’ total imports in June 2012 from East Asia accounted for 38.2 percent of the county’s total imports with total payments of $1.951 billion or a positive annual growth of 25.4 percent from June 2011 level of $1.555 billion. Total exports to member-countries of East Asia were valued at $1.988 billion, resulting to a total trade of $3.939 billion and a balance of trade in goods (BOT-G) surplus of $37.80 million.
Imports from ASEAN member-countries recorded at $1.212 billion, contributed a 23.7 percent share to total imports. It grew by 16.6 percent compared from $1.039 billion value in June 2011. On the other hand, exports to ASEAN member-countries worth $719.85 million resulted to a total trade of $1.931 billion and a trade deficit of $491.68 million.
June 2012 imports from European Union were valued at $386.44 million while exports to member-countries of European Union were worth $649.77 million. These aggregated to a total trade value of $1.036 billion and a trade surplus of $263.33 million.
Notes:
1/ - includes China, Hong Kong, Japan, Macau, Mongolia, N, Korea, S. Korea, Taiwan
2/ - includes Brunei Darussalam, Cambodia, Indonesia, Laos, Malaysia, Myanmar,
Singapore, Thailand, Vietnam
3/ - includes Alaska and Hawaii
4/ - includes Austria, Belgium, Bulgaria, Cyprus, Czech Republic, Denmark, Estonia,
Finland, France, Germany, Greece, Hungary, Ireland, Italy, Latvia, Lithuania,
Luxembourg, Malta, Netherlands, Poland, Portugal, Romania, Slovakia, Slovenia,
Spain, Sweden and UK Great Britain
Technical Notes:
- Adjustments on electronic import statistics are based on the transactions that pass through the Electronic to Mobile (e2m) of the Bureau of Customs (BOC).
- Starting with the 2007 Press Release, analysis and tables are based on the 2004 Philippine Standard Commodity Classification (PSCC) groupings. This is in compliance with NSCB Resolution No. 03, Series of 2005 entitled “Approving and Adopting the 2004 Philippine Standard Commodity Classification” by all concerned government agencies and instrumentalities.
CARMELITA N. ERICTA
Administrator
Source: Foreign Trade Statistics Section
Industry and Trade Statistics Department
National Statistics Office
Manila, Philippines