
January to October total trade stands at $66.54 billion
Total external trade in goods for January to October 2004 amounted to $66.54 billion representing an increment of 8.9 percent from $61.117 billion during the same period last year. Total foreign-made merchandise as well grew by 8.8 percent to $33.900 billion from $31.147 billion. Likewise, exports registered a year-on-year growth rate of 8.9 percent to aggregate dollar revenue of $32.643 billion from $29.971 billion a year earlier. Balance of trade in goods (BOT-G) deficit for the Philippines reached $1.257 billion, higher than last years deficit of $1.176 billion.
Figure 1A. Philippine Trade Performance in January - October :2003 and 2004
(F.O.B. Value in Million US Dollar)
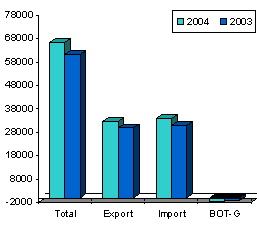
Figure 1B. Philippine Trade Performance in October :2003 - 2004
(F.O.B. Value in Million US Dollar)
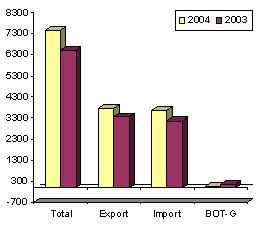
October imports register 16.3 percent increase
Total merchandise trade for October 2004 went up by 14.3 percent to $7.420 billion from $6.494 billion during the same period of the previous year. Dollar-inflow generated by exports amounted to $3.751 billion, or 12.3 percent higher than last years $3.3.340 billion. Similarly, expenditures for imported goods rose by 16.3 percent to $3.669 billion from $3.154 billion. The balance of trade in goods (BOT-G) registered a surplus for the Philippines at $82 million, lower compared to last years surplus of $186 million.
Electronic products account for 43.1 percent of import bill
Accounting for 43.1 percent of the total aggregate import bill, payments for electronic products amounted to $1.582 billion or a 5.6 percent increment over last year's reported figure at $1.498 billion. Compared to the previous months level, purchases inched up by 1.8 percent from $1.554 billion.
Imports of mineral fuels, lubricants and related materials ranked second with 13.2 percent share. Expenditures at $484.10 million, posted a 92.5 percent growth over the previous year's level which stood at $251.44 million.
Industrial machinery and equipment, the third top import was worth $146.23 million, or an increase of 2.0 percent from $143.33 million a year ago.
Iron and steel, accounting for 3.2 percent of the total imports, ranked fourth as foreign bill amounted to $116.06 million, higher by 30.0 percent from $89.28 million last year.
Transport equipment, contributing 3.0 percent to the total bill, was RP's fifth top import for the month with payments placed at $109.24 million or an addition of 13.8 percent from last year's $95.95 million.
Expenditures for textile yarn, fabrics, made-up articles and related products, with a 2.2 percent share to the aggregate bill, picked up by 5.1 percent to $81.94 million from $7.99 million in October 2003.
Rounding up the list of the top imports for October 2004 were telecommunication equipment and electrical machinery, $75.21 million; organic and inorganic chemical, $71.76 million; plastics in primary and non-primary forms, $71.37 million; and dairy products, $49.85 million.
Aggregate payment for the country's top ten imports for October 2004 reached to $2.788 billion or 75.99 percent of the total bill.
Figure 2. Philippine Top Imports in October 2003 and 2004
(F.O.B. Value in Million US Dollar)

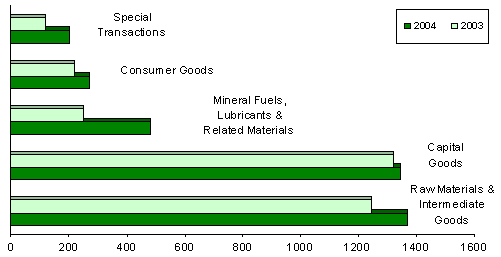
Raw materials and intermediate goods account for 37.3 percent of the total imports
Payments for raw materials and intermediate goods accounted for 37.3 percent as importation climbed by 10.1 percent to $1.369 billion from last year�s reported figure of $1.244 billion. Semi-processed raw materials got the biggest share with a 34.1 percent and valued at $1.250 billion.
Capital goods comprising 36.6 percent of the total imports gained by 1.8 percent year-on-year to $1.345 billion from $1.321 billion. The principal share went to telecommunication equipment and electrical machinery with a 20.6 percent share of the total imports and billed at $755.81 million.
Expenditures for mineral fuels, lubricants and related materials grew by as much as 92.5 percent to $484.10 million from $251.44 million during the same period of 2003.
Purchases of consumer goods, valued at $269.82 million rose by 23.7 percent from $218.19 million in October 2003; while special transactions improved by 67.5 percent to $200.75 million from $119.86 million.
Figure 3. Philippine Imports by Major Type of Goods in October: 2003 and 2004
Japan corners 17.4 percent of october import bill
Imports from Japan accounting for 17.4 percent of the total import bill, declined by 7.1 percent to $639.92 million from $688.62 million during the same period of 2003. On the other hand, exports to Japan, amounted to $888.37 million yielding a two-way trade value of $1.528 billion and a trade surplus for RP placed at $248.46 million.
United States, the country's second biggest source of imports with a 15.5 percent share, reported shipments billed at $568.12 million against exports earnings of $564.99 million. Total trade amounted to $1.133 billion, with a trade deficit for the Philippines registered at $3.13 million.
Singapore followed as the third biggest source of imports. With payments worth $308.48 million, imports increased by 40.8 percent from $219.12 million, while revenue from RP's exports reached $196.11 million resulting to a total trade value of $504.59 million and a $112.37 million deficit for Philippines.
Other major sources of imports for the month of October were Taiwan, $301.54 million; People's Republic of China, $224.21 million; Republic of Korea, $212.38 million; Saudi Arabia, $204.78 million; Hong Kong, $147.34 million; Malaysia, $139.76 million; and Thailand, $134.41 million.
Payments for imports from the top ten sources for the month amounted to $2.881 billion or 78.5 percent of the total.
Figure 4. Philippine Imports by Country in October: 2004

As of press time 32 out of 57,052 export documents and 31 out of 80,977 import documents are still expected from the ports.
|
(Sgd.) CARMELITA N. ERICTA |
Source: National Statistics Office
Manila, Philippines