|
||||||||||||||||||||||||||||||||||||||||||||||||
r - revised
|
Top 10 Philippine Imports from All Countries: October 2005 |
|||
|
Gainers |
Losers |
||
|
Transport Equipment |
78.1 |
Mineral Fuels, Lubricants and Related Materials |
-19.5 |
|
Textile Yarn, Fabrics, Made-Up Articles and Related Products |
23.4 |
Iron and Steel |
-8.8 |
|
Cereals and Cereal Preparations |
21.8 |
Electronic Products |
-5.7 |
|
Plastics in Primary and Non-Primary Forms |
11.8 |
|
|
|
Industrial Machinery and Equipment |
10.1 |
|
|
|
Organic and Inorganic Chemical |
8.1 |
|
|
|
Telecommunication Equipment and Electrical Machinery |
0.2 |
|
|
January to October total trade stands at $70.895 billion
Total external trade in goods for January to October 2005 reached $70.895 billion, a 1.5 percent growth from $69.835 billion during the same period of the previous year. Expenditures for total foreign-made merchandise slightly increased by 0.3 percent to $37.227 billion from $37.117 billion.Similarly, exports registered a year-on-year increment of 2.9 percent to aggregate dollar revenue of $33.668 billion from $32.718 billion a year ago. Balance of trade in goods (BOT-G) deficit for the Philippines reached $3.559 billion, lower compared to last year’s deficit of $4.399 billion.
Figure 1A. Philippine Trade Performance in January - October :2005 and 2004
(F.O.B. Value in Million US Dollar)
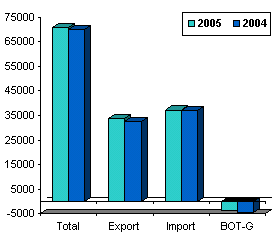
Figure 1B. Philippine Trade Performance in October :2005 - 2004
(F.O.B. Value in Million US Dollar)
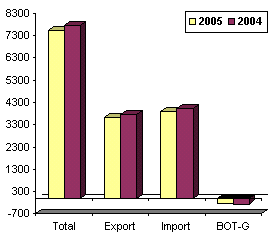
October imports register 3.1 percent decrease
Total merchandise trade for October 2005 went down by 3.2 percent to $7.517 billion from $7.761 billion during the same period a year earlier. Dollar-inflow generated by exports amounted to $3.634 billion, or 3.2 percent lower than last year’s $3.753 billion. On the other hand, foreign bill on imported goods dropped by 3.1 percent to $3.882 billion from $4.008 billion. The BOT-G registered a deficit of $248 million, lower compared to last year’s deficit of $254 million.
Electronic products account for 48.6 percent of import bill
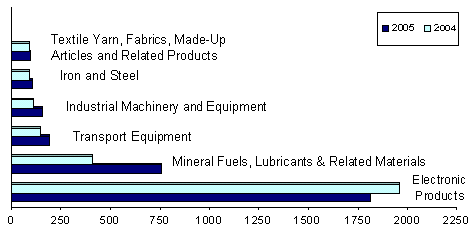
Accounting for 48.6 percent of the total aggregate import bill, payments for electronic products amounted to $1.886 billion or a decline of 5.7 percent over last year’s figure of $2.000 billion. Compared to the previous month’s level, purchases gained by 3.5 percent from $1.822 billion.
Imports of mineral fuels, lubricants and related materials in October ranked second with 10.0 percent share. Expenditures at $389.90 million, registered a 19.5 percent decrease over the previous year’s level of $484.13 million.
Transport equipment, contributing 5.0 percent to the total bill, was RP’s third top import for the month with payments at $194.56 million from last year’s $109.24 million. The double-digit increase of 78.1 percent was brought about by importations made on passenger cars, components, parts and accessories of motor vehicles.
Industrial machinery and equipment, the fourth top import was worth $160.97 million, or an increment of 10.1 percent from $146.24 million a year earlier. This was due to the high value of imports on parts of machinery and mechanical appliances.
Expenditures for iron and steel, with a 2.7 percent share, was down by 8.8 percent to $105.86 million from $116.06 million in October 2004.
Textile yarn, fabrics, made-up articles and related products, accounted for 2.6 percent of the total imports, with foreign bill amounting to $101.04 million from $81.91 million last year. Higher value in the importation of fabrics for embroidery and yarns mainly contributed the growth of 23.4 percent.
Rounding up the list of the top imports for October 2005 were plastics in primary and non-primary forms, $79.81 million, organic and inorganic chemicals, $77.62 million, telecommunication equipment and electrical machinery, $75.39 million. Cereals and cereal preparations, accounting for 1.3 percent of the total imports, recorded an increase of 21.8 percent with foreign bill amounting to $49.27 million from $40.44 million last year as higher values were noted in the importation of wheat, corn and rice.
Aggregate payment for the country’s top ten imports for October 2005 reached $3.120 billion or 80.4 percent of the total bill.
Figure 2. Philippine Top Imports in October 2005 and 2004
(F.O.B. Value in Million US Dollar)
Raw materials and intermediate goods account for 41.7 percent of the total imports
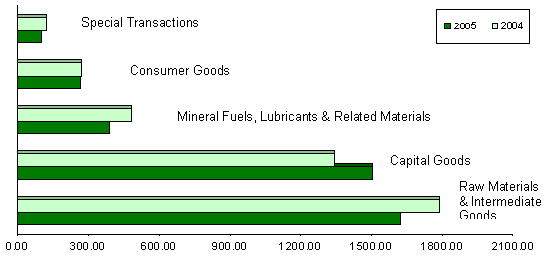
Payments in October for raw materials and intermediate goods accounted for 41.7 percent share as importation fell by 9.4 percent to $1.620 billion from last year’s figure of $1.787 billion. Semi-processed raw materials got the biggest share of 38.6 percent and valued at $1.497 billion.
Capital goods comprising 38.8 percent of the total imports, moved up by 11.9 percent year-on-year to $1.505 billion from $1.345 billion. The major share went to telecommunication equipment and electrical machinery with a 21.7 percent share of the total imports and valued at $840.87 million.
Expenditures for mineral fuels, lubricants and related materials declined by 19.5 percent to $389.90 million from $484.13 million during the same period of 2004.
Purchases of consumer goods, amounted to $265.63 million, a drop of 1.6 percent from $269.83 million in October 2004, while special transactions decreased by 16.5 percent to $101.65 million from $121.80 million.
Figure 3. Philippine Imports by Major Type of Goods in October: 2005 and 2004
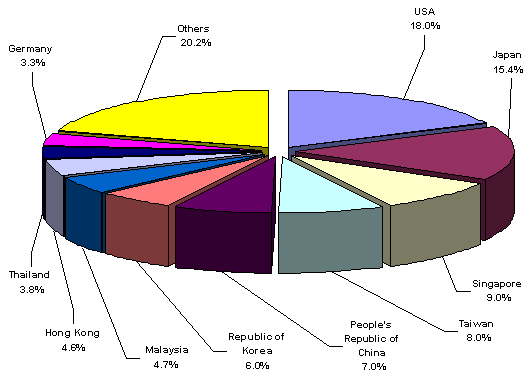
United States corners 18.0 percent of october import bill
Imports from US accounting for 18.0 percent of the total import bill, went down by 2.2 percent to $699.80 million from $715.14 million during the same period of 2004. Exports to US, amounted to $692.45 million yielding a two-way trade value of $1.392 billion and a trade deficit for RP placed at $7.35 million.
Japan, the country’s second biggest source of imports for October with a 15.4 percent share, reported shipments billed at $596.31 million against export earnings of $516.59 million. Total trade amounted to $1.113 billion, with a trade deficit registered at $79.72 million.
Singapore followed as the third biggest source of imports. With payments worth $351.50 million, imports picked up by 4.0 percent from $337.97 million, while revenue from RP’s exports reached $310.23 million resulting to a total trade value of $661.73 million and a $41.28 million deficit for Philippines.
Other major sources of imports for the month of October were Taiwan, $309.10 million; People’s Republic of China, $270.41 million; Republic of Korea, $231.85 million; Malaysia, $181.61 million; Hong Kong, $180.65 million; Thailand, $149.22 million; and Germany, $127.76 million.
Payments for imports from the top ten sources for the month amounted to $3.098 billion or 79.8 percent of the total.
Figure 4. Philippine Imports by Country in October: 2005
Technical Notes
Adjustments on electronics import statistics are based on approved valuation methodology as per NSCB Resolution No. 8 Series of 2005.
|
(Sgd.) CARMELITA N. ERICTA |
Source: National Statistics Office
Manila, Philippines
