
| |||||||||||||||||||||||||||||||||||||||||||||||
| |||||||||||||||||||||||||||||||||||||||||||||||
r - revised
Top 10 Philippine Imports from All Countries: October 2008 | |||
Gainers | Losers | ||
| Transport Equipment | 32.1 | Cereals and Cereal Preparations | -34.8 |
| Non-Ferrous Metal | 28.2 | Electronic Products | -30.0 |
| Organic and Inorganic Chemicals | 22.2 | Mineral Fuels, Lubricants and Related Materials | -5.0 |
| Telecommunication Equipment and Electrical Machinery | 14.2 |
|
|
| Iron and Steel | 9.7 |
| |
| Plastics in Primary and Non-Primary Forms | 7.6 |
| |
| Industrial Machinery and Equipment | 4.0 |
| |
|
| ||
JANUARY TO OCTOBER 2008 TOTAL TRADE STANDS AT $92.701 BILLION
Total external trade in goods for January to October 2008 reached $92.701 billion, a 6.0 percent increment from $87.448 billion during the 10-month period in 2007. This is due to the 9.8 percent growth of the total imports to $49.863 billion from $45.429 billion during the 10-month period in 2007. On the other hand, total exports posted a growth of 1.9 percent for January to October 2008 to aggregate dollar revenue of $42.838 billion from $42.019 billion in the same period last year. Balance of trade in goods (BOT-G) during the 10-month period in 2008 registered a deficit of $7.025 billion from $3.410 billion deficit in the same period last year.
Figure 1A Philippine Trade Performance in January - October : 2007 and 2008
(F.O.B. Value in Million US Dollar) 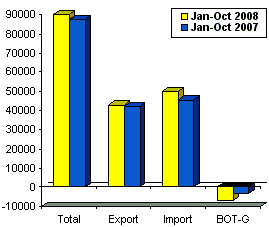
Figure 1B Philippine Trade Performance in October : 2007 and 2008
(F.O.B. Value in Million US Dollar)
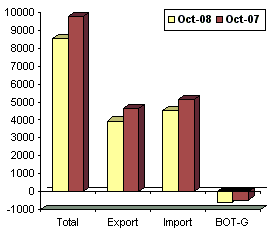
OCTOBER 2008 IMPORTS FELL BY 11.1 PERCENT
Total merchandise trade for October 2008 declined by 12.9 percent to $8.548 billion from $9.810 billion in October 2007. Exports receipts in October 2008 totaled to $3.971 billion, down by 14.8 percent from last year�s $4.660 billion. Similarly, the country’s merchandise imports, decreased by 11.1 percent to $4.577 billion from $5.151 billion in October 2007. The balance of trade in goods (BOT-G) in October 2008 recorded a deficit of $606.08 million from $491.11 million deficit in the same period last year.
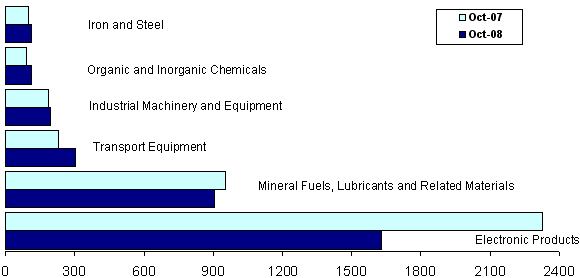
ELECTRONIC PRODUCTS ACCOUNT FOR 35.6 PERCENT OF IMPORT BILL
Accounting for 35.6 percent of the aggregate import bill, payments for Electronic Products in October 2008 amounted to $1.628 billion fell by 30.0 percent over last year's figure of $2.326 billion. Similarly, month-on-month, it reflected a decrease of 5.6 percent from $1.724 billion recorded in September 2008. Among the major groups of electronic products, Components/Devices (Semiconductors) had the biggest share of 27.0 percent, down by 31.9 percent to $1.235 billion from $1.814 billion in October 2007.
Imports of Mineral Fuels, Lubricants and Related Materials in October 2008 ranked second with 19.7 percent share and posted a negative growth of 5.0 percent to $903.54 million over the previous year’s level of $951.36 million.
Transport Equipment, contributing 6.6 percent to the total import bill, was the RP's third top import for the month with payments placed at $303.85 million from last year�s $229.97 million or an increase of 32.1 percent.
Industrial Machinery and Equipment ranking fourth with a share of 4.2 percent at $193.61 million worth of imports, went up by 4.0 percent from its year ago level of $186.16 million.
Organic and Inorganic Chemicals, accounting for 2.4 percent of the total imports, ranked fifth as foreign bill amounted to $111.89 million, up by 22.2 percent from $91.54 million last year.
Iron and Steel ranked sixth, comprising 2.4 percent of the total imports registered $110.62 million worth of imports; rose by 9.7 percent from its year ago level of $100.79 million.
Rounding up the list of the top ten imports for October 2008 were, Plastics in Primary and Non-Primary Forms, $94.25 million; Telecommunication Equipment and Electrical Machinery,$88.34 million; Cereals and Cereal Preparations, 84.56; and Non-Ferrous Metal, $70.57 million.
Aggregate payment for the country’s top ten imports for October 2008 reached $3.589 billion or 78.4 percent of the total import bill.
Figure 2 Philippine Top Six Imports in October : 2007 and 2008
(F.O.B. Value in Million US Dollar)
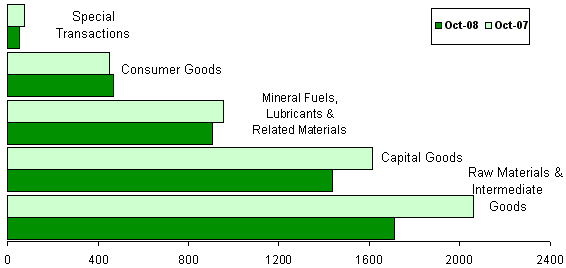
RAW MATERIALS AND INTERMEDIATE GOODS ACCOUNT FOR 37.4 PERCENT OF THE TOTAL IMPORTS
Accounting for 37.4 percent of the total imports, payments in October 2008 for Raw Materials and Intermediate Goods amounted to $1.713 billion or a 16.9 percent decline over last year's figure of $2.060 billion. Compared to the previous month's level, purchases also went down by 4.1 percent from $1.786 billion. Semi-Processed Raw Materials had the biggest share of 33.9 percent and valued at $1.552 billion.
Capital Goods, which comprised 31.5 percent of the total imports, went down by 10.8 percent year-on-year, to $1.440 billion from $1.614 billion.
Mineral Fuels, Lubricants and Related Materials with 19.7 percent share, decreased by 5.0 percent to $903.54 million from $951.36 million in October 2007.
Purchases of Consumer Goods amounted to $466.67 million or an increase of 3.9 percent from $449.02 million in October 2007, while Special Transactions dropped by 28.7 percent to $53.99 million from $75.75 million in October 2007.
Figure 3 Philippine Imports by Major Type of Goods in October: 2007 and 2008
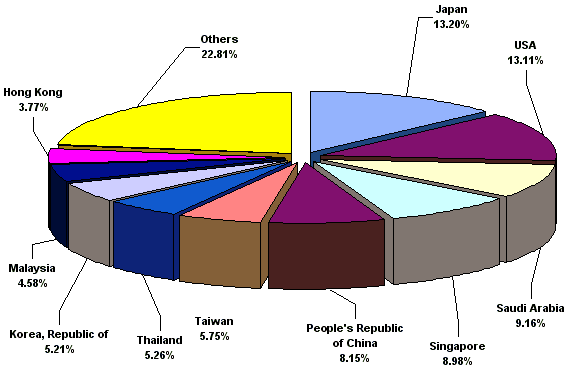
JAPAN CORNERS 13.2 PERCENT OF OCTOBER 2008 IMPORT BILL
Imports from Japan, the country’s biggest source for October 2008 with 13.2 percent share of the total import bill was down by 12.7 percent to $604.37 million from $692.25 million in October 2007. Exports to Japan amounted to $614.85 million, yielding a two-way trade value of $1.219 billion and a trade surplus for RP at $10.48 million.
United States of America (USA), the second biggest source of imports with 13.1 percent share, recorded payments worth $600.21 million and declined by 11.2 percent from $676.19 million in October 2007. Revenue from RP’s exports to USA, on the other hand, reached $694.97 million, generating a total trade value of $1.295 billion and $94.76 million trade surplus for the Philippines.
Saudi Arabia came third; accounting for 9.2 percent share of the total import bill in October 2008, up by 18.8 percent to $419.43 million from $352.95 million during the same month in 2007. Exports toSaudi Arabia amounted to $5.16 million resulting to a total trade value of $424.59 million and a trade deficit of $414.27 million.
Singapore settled fourth, accounting for 9.0 percent share of the total import bill in October 2008, declined by 28.3 percent to $410.88 million from $573.18 million during the same month in 2007. Exports to Singapore amounted to $147.73 million resulting to a total trade value of $558.62 million and a trade deficit of $263.15 million for the Philippines.
Other major sources of imports for the month of October 2008 were People’s Republic of China,$373.11 million; Taiwan, $263.23 million; Thailand, $240.83 million; Republic of Korea, $238.42 million; Malaysia, $209.62 million; and, Hong Kong $172.76 million.
Payments for imports from the top ten sources for October 2008 amounted to $3.533 billion or 77.2 percent of the total.
Figure 4 Philippine Imports by Country in October: 2008
Technical Notes:
1. Adjustments on electronic import statistics are based on the transactions that pass through the Automated Cargo Operating System (ACOS) of the Bureau of Customs (BOC).
2. Starting on January 2007 Press Release, analysis and tables are based on 2004 Philippine Standard Commodity Classification (PSCC) groupings. This is in compliance with NSCB Resolution No. 03, Series of 2005 entitled Approving and Adopting the 2004 Philippine Standard Commodity Classification by all concerned government agencies and instrumentalities.
(Sgd.) CARMELITA N. ERICTA |
Source: Foreign Trade Statistics Section
Industry and Trade Statistics Department
National Statistics Office
Manila, Philippines