
EXTERNAL TRADE PERFORMANCE
October 2012
(Preliminary)
p-preliminary
r-revised


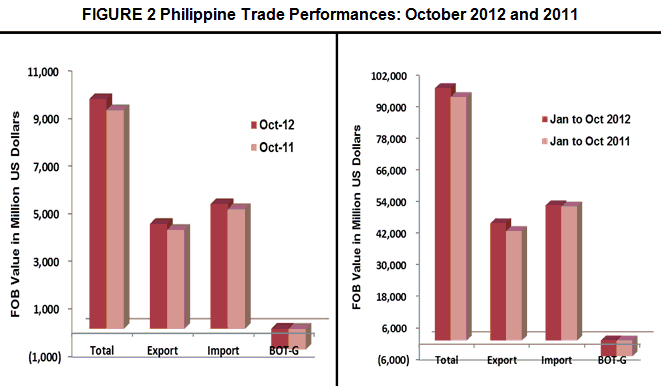
OCTOBER 2012 TOTAL TRADE STANDS AT $9.648 BILLION
Total external trade in goods for October 2012 reached $9.648 billion, representing a 5.1 percent increase from $9.180 billion recorded during the same month in 2011. The increase can be attributed to the 6.1 percent positive growth of exports to $4.408 billion from $4.156 billion in the same month a year ago. Also, total imports expanded by 4.3 percent to $5.240 billion from $5.024 billion in October 2011. Thus, the balance of trade in goods (BOT-G) for the Philippines in October 2012 registered a deficit of $832 million from $869 million deficit in the same period last year.
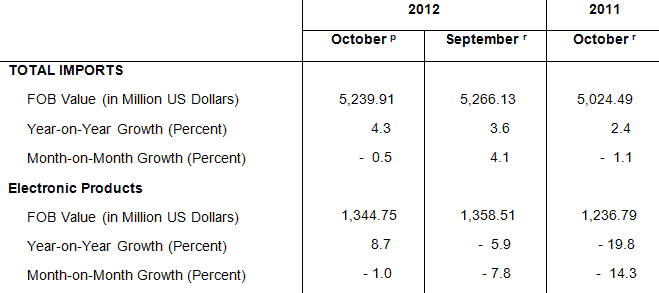
OCTOBER 2012 IMPORTS GREW BY 4.3 PERCENT
The country’s total merchandise imports for October 2012 went up by 4.3 percent to $5.240 billion from $5.024 billion. Metalliferous Ores and Metal Scrap, Cereals and Cereal Preparations, Transport Equipment, Telecommunication, Equipment and Electrical Machinery, Electronic Products and Industrial Machinery and Equipment, all contributed to the overall growth in imports for the period. However, it slightly went down by 0.5 percent compared to previous month’s level of $5.266 billion. On the other hand, aggregate imports slightly went up by 0.9 percent to $51.275 billion value in the first ten months of 2012 from $50.839 billion for the same period in 2011.
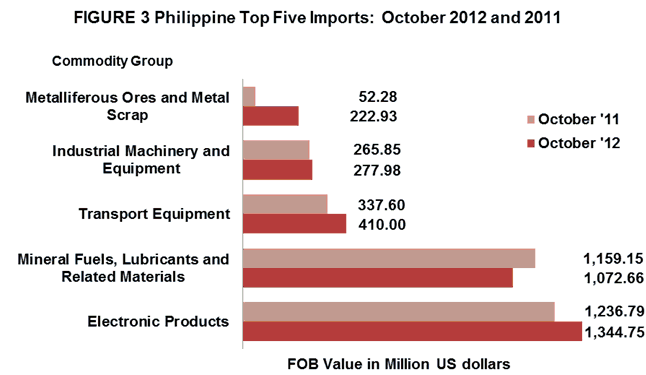
ELECTRONIC PRODUCTS ACCOUNT FOR 25.7 PERCENT OF IMPORT BILL
Accounting for 25.7 percent of the aggregate import bill, payments for Electronic Products (including consigned and direct importation using the expanded coverage of electronic products) rose by 8.7 percent to $1.345 billion reported value from $1.237 billion in October 2011. Among the major groups of electronic products, Components/Devices (Semiconductors) having the biggest share of 19.7 percent increased by 16.8 percent to $1.034 billion from $885.59 million. However, compared to previous month, higher purchases of semiconductors at 4.2 percent was registered which offset the decline of electronic products at 1.0 percent. On the other hand, reduced volume of shipments both for electronic products and semiconductors were recorded at 3.5 percent and 14.2 percent respectively for the period in review.
Import bill payments for Mineral Fuels, Lubricants and Related Materials ranked second among the top ten imports with 20.5 percent share to total imports registering an annual growth rate decrease of 7.5 percent from $1.159 billion in October 2011 to $1.073 billion. The contraction may be attributed to the lower payments and decreased in the global price of this product.
Transport Equipment was the PH’s third top import for the month with 7.8 percent share to total imports valued at $410.00 million from $337.60 million in same month a year ago. Similarly, in terms of volume of inward shipments, it expanded by 38.4 percent compared to the recorded volume of inward shipment a year ago.
Industrial Machinery and Equipment contributing 5.3 percent to the total import bill was the fourth top import for the month amounting to $277.98 million. Compared to last year’s amount of $265.85 million, it went up by 4.6 percent. Month on month, an 8.0 percent increase was shown compared to recorded value of $257.38 million in September 2012. Similarly, volume purchases went up by 15.3 percent from the same period last year.
Fifth in rank and with 4.3 percent share to the total imports was Metalliferous Ores and Metal Scrap, which recorded the highest growth at 326.4 percent among the top ten imports for October 2012 to $222.93 million worth of imports from its year ago level of $52.28 million. This growth was brought about by 124.9 percent increase in volume of imports compared to October 2011.
Rounding up the list of the top ten imports for October 2012 were Cereals and Cereal Preparations, $187.67 million; Iron and Steel, $125.51 billion; Organic and Inorganic Chemicals, $120.54 million; Plastics in Primary and Non-Primary Forms, $115.39 million; and Telecommunication Equipment and Electrical Machinery, $108.31 million.
Aggregate payment for the country’s top ten imports for October 2012 reached $3.986 billion or 76.1 percent of the total import bill.
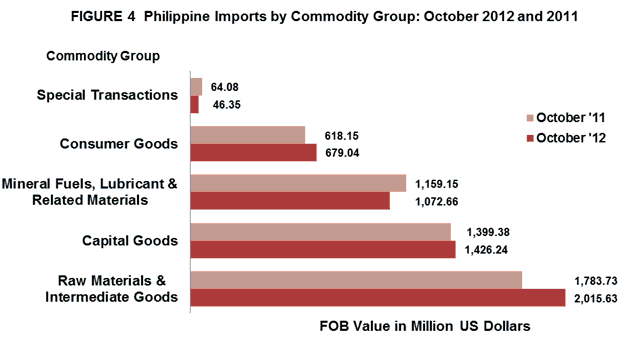
RAW MATERIALS AND INTERMEDIATE GOODS ACCOUNT FOR 38.5 PERCENT OF THE TOTAL IMPORTS
Raw Materials and Intermediate Goods comprised 38.5 percent of the total imports in October 2012. Year-on-year change went up by 13.0 percent to $2.016 billion from $1.784 billion. The expansion was brought about by the 107.4 percent increase in the value of unprocessed raw materials and 1.2 percent increased in semi-processed raw materials. However, volume of inward shipments for this product went down by 25.2 percent.
Accounting for 27.2 percent of the total imports, payments for Capital Goods amounted to $1.426 billion or a 1.9 percent increment over last year's figure of $1.399 billion. Similarly, purchases went up by 5.4 percent compared to previous month's value of $1.353 billion. However, an increase of 21.1 percent in the volume of inward shipment was registered compared to last year’s volume of purchases of capital goods.
Purchases of Consumer Goods amounted to $679.04 million or a positive growth of 9.8 percent from $618.15 million in October 2011. The increase was brought about by the 2.5 percent increase in purchases of durable goods and 18.9 percent of non-durable goods. On the other hand, volume of inward shipments showed a 51.0 percent increase compared to same month a year ago volume of shipments.
Imports of commodities under Special Transactions valued at $46.35 million dropped by 27.7 percent from $64.08 million recorded in October 2011. Similarly, total volume of inward manifest registered a 14.6 percent drop compared to it’s year ago volume of importation.
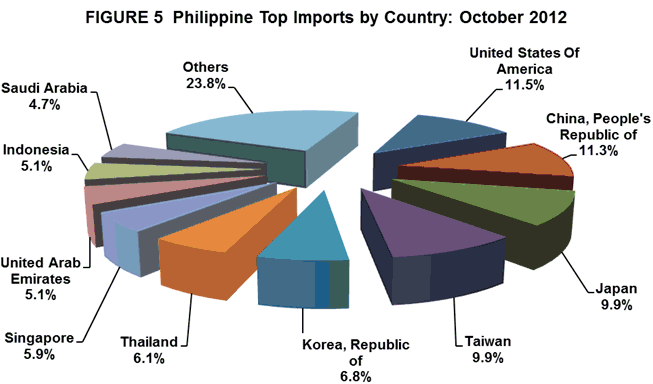
IMPORTS FROM UNITED STATES OF AMERICA ACCOUNT FOR 11.5 PERCENT
United States of America (USA) including Alaska and Hawaii was the country’s biggest source of imports in October 2012 with 11.5 percent share. Payments were recorded at $603.96 million, an increase of 22.3 percent from $493.70 million in October 2011. The increase in the inward purchases from USA includes imported commodities like components/devices (semiconductors) and cereals and cereal preparations specifically wheat. Revenue from PH’s exports to USA, on the other hand, reached $583.56 million, generating a total trade value of $1.188 billion and $20.40 million trade deficit for the Philippines.
People’s Republic of China was the second top source of imports with 11.3 percent share to the total import bill amounting to $589.97 million, higher by 23.3 percent from $478.43 million in October 2011. The expansion on inward value of shipments maybe accounted to the imports of commodities such as telecommunication equipment and electrical machinery and mineral fuels, lubricants and related materials. Exports to People’s Republic of China amounted to $548.43 million, yielding a two-way trade value of $1.138 billion and a trade deficit for PH of $41.55 million.
Japan including Okinawa came in third, accounting for 9.9 percent share of the total import bill in October 2012 with negative growth of 14.6 percent from $607.45 million to $518.91 million. Purchases on components/devices (semiconductors) and transport equipment were recorded imports from Japan. Exports to Japan amounted to $730.71 million resulting to a total trade value of $1.250 billion and a trade surplus of $211.80 million.
Taiwan ranked fourth among the top sources of imports for the country accounting for almost 9.9 percent share of the total import bill in October 2012. It increased by 57.3 percent to $516.36 million from $328.33 million. Commodities purchased from Taiwan in October 2012 were mostly mineral fuels and lubricants and components/devices (semiconductors). On the other hand, exports to Taiwan amounted to $157.82 million resulting to a total trade value of $674.19 million and a trade deficit of $358.54 million.
Fifth in rank was Republic of Korea, representing 6.8 percent of the total import bill in October 2012 or a decrease of 12.8 percent from $405.62 million to $353.83 million in the same month last year. Mineral, fuels and lubricants and components/devices (semiconductors) were among the highest imported goods from Republic of Korea in October 2012. Exports to Republic of Korea amounted to $352.19 million resulting to a total trade value of $706.02 million and a trade deficit of $1.65 million.
Other major sources of imports for the month of October 2012 were Thailand, $318.60 million; Singapore, $307.50 million; United Arab Emirates, $267.34 million; Indonesia, $265.76 million; and Saudi Arabia, $248.80 million.
Payments for imports from the top ten sources for October 2012 amounted to $3.991 billion or 76.2 percent of the total.
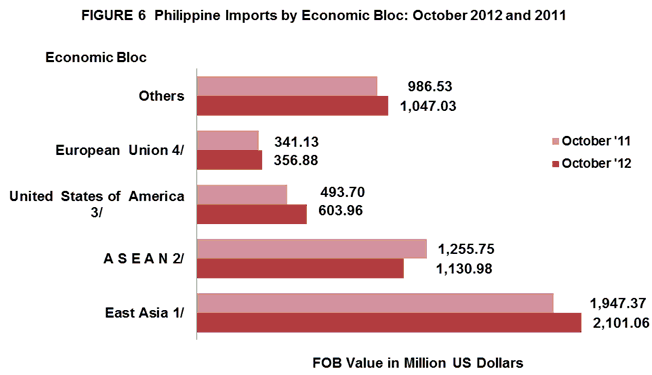
IMPORTS FROM EAST ASIA WORTH $2.101 BILLION
Philippines’ total imports in October 2012 from East Asia accounted for 40.1 percent of the county’s total imports with total payments of $2.101 billion or a positive annual growth of 7.9 percent from October 2011 level of $1.947 billion. Total exports to member-countries of East Asia were valued at $2.439 billion, resulting to a total trade of $4.540 billion and a balance of trade in goods (BOT-G) surplus of $337.82 million.
Imports from ASEAN member-countries recorded 21.6 percent share to total imports. Imports value recorded for October 2012 was $1.131 billion and $1.256 billion in same month in 2011. On the other hand, exports to ASEAN member-countries worth $643.47 million resulted to a total trade of about $1.774 billion and a trade deficit of $487.51 million.
October 2012 imports from European Union were valued at $356.88 million while exports to member-countries of European Union were worth $432.11 million. These aggregated to a total trade value of $788.99 million and a trade surplus of $75.23 million.
Notes:
1/ - includes China, Hong Kong, Japan, Macau, Mongolia, N, Korea, S. Korea, Taiwan
2/ - includes Brunei Darussalam, Cambodia, Indonesia, Laos, Malaysia, Myanmar, Singapore, Thailand, Vietnam
3/ - includes Alaska and Hawaii
4/ - includes Austria, Belgium, Bulgaria, Cyprus, Czech Republic, Denmark, Estonia, Finland, France, Germany,
Greece, Hungary, Ireland, Italy, Latvia, Lithuania, Luxembourg, Malta, Netherlands, Poland, Portugal,
Romania, Slovakia, Slovenia, Spain, Sweden and UK Great Britain
Technical Notes:
- Adjustments on electronic import statistics are based on the transactions that pass through the Electronic to Mobile (e2m) of the Bureau of Customs (BOC).
- Starting with the 2007 Press Release, analysis and tables are based on the 2004 Philippine Standard Commodity Classification (PSCC) groupings. This is in compliance with NSCB Resolution No. 03, Series of 2005 entitled “Approving and Adopting the 2004 Philippine Standard Commodity Classification” by all concerned government agencies and instrumentalities.
CARMELITA N. ERICTA
Administrator