
|
|||||||||||||||||||||||||||||||||||||||||||||||
|
|
|||||||||||||||||||||||||||||||||||||||||||||||
r - revised
|
Top 10 Philippine Imports from All Countries: September 2006 |
|||
|
Gainers |
Losers |
||
|
Organic and Inorganic Chemicals |
46.7 |
Mineral Fuels, Lubricants and Related Materials |
-37.0 |
|
Transport Equipment |
44.4 |
Iron and Steel |
-25.6 |
|
Cereals and Cereal Preparations |
38.9 |
Industrial Machinery and Equipment |
-10.7 |
|
Textile Yarn, Fabrics, Made-Up Articles and Related Products |
9.8 |
Telecommunication Equipment and Electrical Machinery |
-10.4 |
|
Electronic Products |
8.9 |
||
|
Plastics in Primary and Non-Primary Forms |
5.0 |
||
JANUARY TO SEPTEMBER TOTAL TRADE STANDS AT $73.293 BILLION
Total external trade in goods for January to September in 2006 reached $73.293 billion representing a 12.3 percent increment from $65.236 billion during the same period a year earlier. Similarly, total foreign-made merchandise grew by 8.9 percent to $38.180 billion from $35.075 billion. Exports on the other hand, registered a positive rate at 16.4 percent to aggregate dollar revenue of $35.113 billion from $30.162 billion of the previous year. Balance of trade in goods (BOT-G) deficit for the Philippines reached $3.067 billion, lower compared to last years deficit of $4.913 billion.
Figure 1A Philippine Trade Performance in January - September : 2005 and 2006
(F.O.B. Value in Million US Dollar)
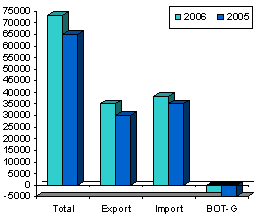
Figure 1B Philippine Trade Performance in September : 2005 and 2006
(F.O.B. Value in Million US Dollar)

SEPTEMBER IMPORTS REGISTER 0.3 PERCENT DECLINE
Total merchandise trade for September 2006 went up by 5.8 percent to $8.479 billion from $8.012 billion during the same period last year. Dollar-inflow generated by exports reached $4.155 billion, or 13.1 percent higher than last years $3.675 billion. However, expenditures for imported goods diminished by 0.3 percent to $4.324 billion from $4.337 billion. The balance of trade in goods (BOT-G) registered a deficit at $169 million, lower from last years deficit of $662 million.
ELECTRONIC PRODUCTS ACCOUNT FOR 50.9 PERCENT OF IMPORT BILL
Accounting for 50.9 percent of the aggregate import bill, payments for Electronic Products amounted to $2.201 billion or an 8.9 percent growth over last year's figure of $2.021 billion. Compared to the previous months level, purchases slightly grew by 0.5 percent from $2.192 billion. Among the major groups of electronic products, Components/Devices (Semiconductors) got the biggest share at 39.5 percent and recorded an increase of 8.0 percent to $1.710 billion from $1.582 billion during the same month in 2005.
Imports of Mineral Fuels, Lubricants and Related Materials in September ranked second with 11.0 percent share but posted a decline of 37.0 percent to $477.57 million over the previous years level of $757.51 million. The decline was due to the reduction in the expenditures on crude petroleum, fuel, motor spirit and other heavy petroleum oils.
Transport Equipment, contributing 5.3 percent to the total bill, was RPs third top import for the month with payments placed at $230.01 million from last years $159.26 million or a year-on-year growth at 44.4 percent. The gain was due to the acquisition of airplanes and other aircrafts, passenger cars, and other components, parts and accessories of other motorcycles and cycles.
Industrial Machinery and Equipment, accounting for a 4.0 percent of the total imports, ranked fourth as foreign bill amounted to $173.81 million or a decline of 10.7 percent from $194.57 million last year.
Textile Yarn, Fabrics, Made-Up Articles and Related Products, ranked fifth comprising 2.5 percent of the total imports, registered a $106.57 million worth of imports or an increase of 9.8 percent from a year ago level of $97.04 million.
Organic and Inorganic Chemical recorded a share of 2.1 percent or $89.20 million worth of imports. This commodity group recorded the highest growth of 46.7 percent due to higher demand for chemicals like sulphuric acid, propylene, and sodium hydroxide.
Rounding up the lists of the top imports for September 2006 were Plastics in Primary and Non-Primary Forms, $87.42 million; Cereals and Cereal Preparation, $84.94 million; Iron and Steel, $81.54 million; and Telecommunication Equipment and Electrical Machinery, $75.93 million.
Aggregate payment for the countrys top ten imports for September 2006 reached $3.608 billion or 83.5 percent of the total bill.
Figure 2 Philippine Top Imports in September : 2005 and 2006
(F.O.B. Value in Million US Dollar)

RAW MATERIALS AND INTERMEDIATE GOODS ACCOUNT FOR 42.9 PERCENT OF THE TOTAL IMPORTS
Payments in September for Raw Materials and Intermediate Goods accounted for 42.9 percent as importation grew by 9.0 percent to $1.856 billion from last years figure of $1.703 billion. Semi-Processed Raw Materials got the biggest share of 39.7 percent and valued at $1.716 billion.
Capital Goods, which comprised of 37.3 percent of the total imports, went up by 7.4 percent year-on-year to $1.613 billion from $1.501 billion. The major share went to Telecommunication Equipment and Electrical Machinery with a 20.9 percent share of the total imports and billed at $902.20 million.
Expenditures for Mineral Fuels, Lubricants and Related Materials with an 11.0 percent share had declined by 37.0 percent to $477.57 million from $757.51 million during the same period of 2005.
Purchases of Consumer Goods amounted to $321.46 million or a growth of 15.1 percent from $279.25 million in September 2005, while Special Transactions dropped by 41.5 percent to $56.22 million from $96.11 million.
Figure 3 Philippine Imports by Major Type of Goods in September: 2005 and 2006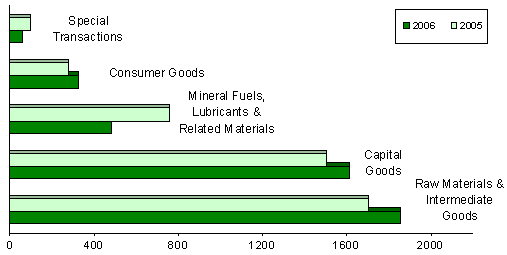
JAPAN CORNERS 16.2 PERCENT OF SEPTEMBER IMPORT BILL
Japan dislodged United States to be the countrys biggest source of imports for September with a 16.2 percent share of the total import bill and grew by 7.7 percent to $698.29 million from $648.45 million during the same month in 2005. Exports to Japan amounted to $646.25 million yielding a two-way trade value of $1.345 billion and a trade deficit for RP at $52.05 million.
United States (US) on the other hand, came second accounting for 15.2 percent of the total import bill, dropped by 23.6 percent to $658.03 million from $861.71 million during the same period of 2005. Exports to US amounted to $824.49 million resulting to a total trade value of $1.483 billion and a trade surplus of 166.47 million.
Taiwan followed as the third biggest source of imports with an 8.3 percent share, recorded payments worth $358.35 million or a year-on-year growth of 3.3 percent. Revenue from RPs exports, on the other hand, reached $194.43 million, which generates a total trade value of $552.78 million and a $163.92 million deficit for Philippines.
Other major sources of imports for the month of September were Singapore, $348.54 million; Peoples Republic of China, $304.12 million; Republic of Korea, $288.98 million; Thailand, $216.86 million; Hong Kong, $199.65 million; Iran, $159.42 million; and Malaysia, $149.94 million.
Payments for imports from the top ten sources for the month amounted to $3.382 billion or 78.2 percent of the total.
Figure 4 Philippine Imports by Country in September: 2006

Technical Notes
1. Adjustments on electronics import statistics are based on the approved valuation methodology as per NSCB Resolution No. 8 Series of 2005 and the inclusion of transactions that passes through Automated Cargo Operating System (ACOS).
2. Analysis and Tables 1 to 5 in this Press Release is based on data using the 1993 Philippine Standard Commodity Classification (PSCC) groupings (as amended in 1999).
3. Starting with the July 2006 series of Foreign Trade Statistics (FTS), additional tables (Tables 6 and 7) using the 2004 PSCC groupings are provided.
4. The adoption of the 2004 PSCC is in compliance with NSCB Resolution No. 03, Series of 2005 entitled " Approving and Adopting the 2004 Philippine Standard Commodity Classification" by all concerned government agencies and instrumentalities.
5. In view of the adoption of the new classification system, the NSO shall issue two sets of detailed tables: 7-digit following the 1993 PSCC (as amended in 1999) and 10-digit using the 2004 PSCC simultaneously, until the December 2006 FTS. However, beginning January 2007 FTS, only the 2004 PSCC groupings will be released by NSO.
6. Detailed tables at commodity levels are available upon request from the NSO-Industry and Trade Statistics Department, 10 days after the monthly press release.
|
(Sgd.) CARMELITA N. ERICTA |
Source: Foreign Trade Statistics Section
Industry and Trade Statistics Department
National Statistics Office
Manila, Philippines