
EXTERNAL TRADE PERFORMANCE
September 2012
(Preliminary)
p-preliminary
r-revised


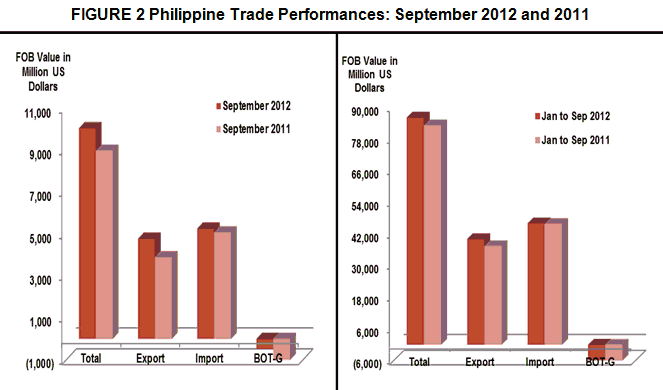
SEPTEMBER 2012 TOTAL TRADE STANDS AT $10.051 BILLION
Total external trade in goods for September 2012 reached $10.051 billion, representing an 11.9 percent increase from $8.980 billion recorded during the same month in 2011. The increase can be attributed to the 22.8 percent positive growth of exports to $4.784 billion from $3.897 billion in the same month a year ago. Also, total imports expanded by 3.6 percent to $5.267 billion from $5.083 billion in September 2011. Thus, the balance of trade in goods (BOT-G) for the Philippines in September 2012 registered a deficit of $483 million from $1.186 billion deficit in the same period last year.
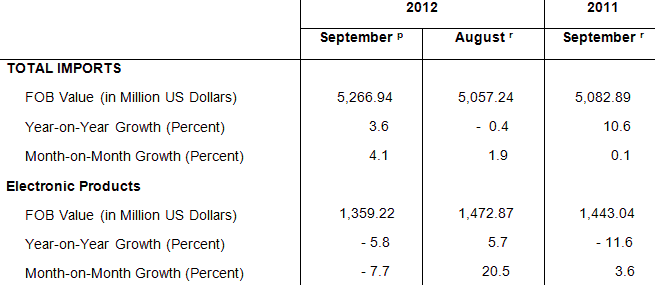
SEPTEMBER 2012 IMPORTS GREW BY 3.6 PERCENT
The country’s total merchandise imports for September 2012 went up by 3.6 percent to $5.267 billion from $5.083 billion. The increment in imports payments resulted mainly on the higher purchases of goods such as Mineral Fuels, Lubricants and Related Materials, Cereals and Cereal Preparations, Telecommunication Equipment and Electrical Machinery, and Industrial Machinery and Equipment. Similarly, it increased by 4.1 percent compared to previous month’s level to $5.057 billion. On the other hand, aggregate imports slightly went up by 0.5 percent to $46.036 billion value in the first nine months of 2012 from $45.814 billion for the same period in 2011.
ELECTRONIC PRODUCTS ACCOUNT FOR 25.8 PERCENT OF IMPORT BILL
Accounting for 25.8 percent of the aggregate import bill, payments for Electronic Products (including consigned and direct importation using the expanded coverage of electronic products) contracted by 5.8 percent to reported value from $1.443 billion to $1.359 billion in September 2012. Among the major groups of electronic products, Components/Devices (Semiconductors) having the biggest share of 18.9 percent decreased by 9.1 percent from $1.092 billion to $993.28 million. Similarly, compared to previous month, electronic products as well as the semiconductors went down by 7.7 percent and 14.5 percent from $1.473 billion and $1.162 billion recorded in August 2012, respectively.
Import bill payments for Mineral Fuels, Lubricants and Related Materials ranked second among the top ten imports with 24.2 percent share to total imports. The annual growth rate went up by 44.2 percent to $1.273 billion from $882.94 million. It was the highest growth among the top ten imports for this month. The expansion may also be attributed to the 22.3 percent increase in volume of inward shipments for this product.
Transport Equipment was the PH’s third top import for the month with 5.6 percent share to total imports valued at $294.08 million. It posted a negative year on year change of 26.4 percent among the top ten imports from $399.82 million of previous year’s value. However, in terms of volume of inward shipments, it expanded by 2.1 percent compared to the recorded value of inward shipment a year ago.
Industrial Machinery and Equipment contributing about 4.9 percent to the total import bill was the fourth top import for the month amounting to $256.69 million. Compared to last year’s amount of $255.57 million, it slightly went up by 0.4 percent. Month on month, a 2.3 percent increase was shown compared to recorded value of $250.85 million in August 2012. Similarly, volume purchases went up by 25.0 percent from the same period last year.
Fifth in rank and with 3.1 percent share to the total imports was Cereals and Cereal Preparations, recorded $164.80 million worth of imports from its year ago level of $120.63 million. An annual positive growth of 36.6 percent was shown because of about 80.0 percent increase in volume of imports compared to September 2011.
Rounding up the list of the top ten imports for September 2012 were Organic and Inorganic Chemicals, $144.29 million; Plastics in Primary and Non-Primary Forms, $129.20 million; Telecommunication Equipment and Electrical Machinery, $105.47 million; Iron and Steel, $104.81 million; and Metalliferous Ores and Metal Scrap valued at $96.67 million.
Aggregate payment for the country’s top ten imports for September 2012 reached $3.928 billion or 74.6 percent of the total import bill.

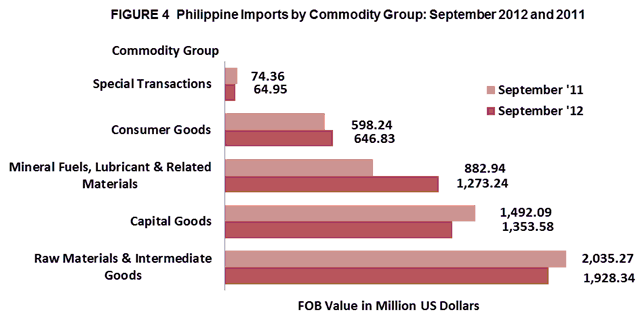
RAW MATERIALS AND INTERMEDIATE GOODS ACCOUNT FOR 36.6 PERCENT OF THE TOTAL IMPORTS
Raw Materials and Intermediate Goods, which comprised 36.6 percent of the total imports in September 2012, year-on-year change went down by 5.3 percent from $2.035 billion to $1.928 billion. The contraction was brought about by the 13.2 percent decline in the value of unprocessed raw materials and 3.8 percent decreased in semi-processed raw materials. However, volume of inward shipments for this product grew by 11.8 percent.
Accounting for 25.7 percent of the total imports, payments for Capital Goods amounted to $1.354 billion or a 9.3 percent decrement over last year's figure of $1.492 billion. Similarly, purchases went down by 1.4 percent from $1.372 billion compared to previous month’s value. However, an increase of 14.5 percent in the volume of inward shipment was registered compared to last year’s volume of purchases of capital goods.
Purchases of Consumer Goods amounted to $646.84 million or a positive growth of 8.1 percent from $598.24 million in September 2011. The increase was brought about by the 14.8 percent increase in purchases of non-durable goods. On the other hand, volume of inward shipments showed a 29.7 percent increase compared to same month a year ago volume of shipments.
Imports of commodities under Special Transactions valued at $64.95 million dropped by 12.7 percent from $74.36 million recorded in September 2011. Similarly, total volume of inward manifest registered a 6.8 percent drop compared to it’s a year ago volume of importation.
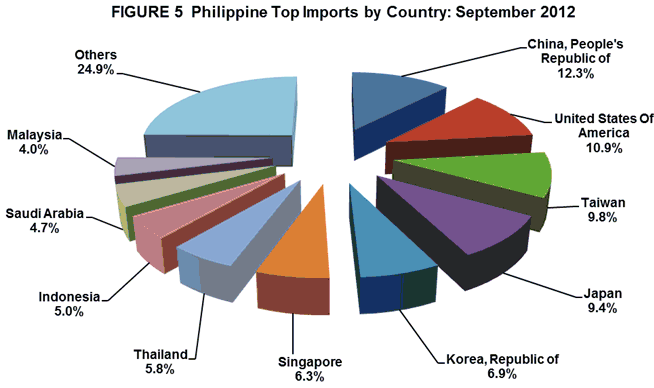
IMPORTS FROM PEOPLE’S REPUBLIC OF CHINA ACCOUNT FOR 12.3 PERCENT
People’s Republic of China was the country’s biggest source of imports in September 2012 with 12.3 percent share. Payments were recorded at $649.22 million, an increase of 30.1 percent from $499.05 million in September 2011. Revenue from PH’s exports to People’s Republic of China, on the other hand, reached $529.12 million, generating a total trade value of $1.178 billion and $120.10 million trade deficit for the Philippines. The increase in the inward purchases from People’s Republic of China include imported commodities like Telecommunication Equipment and Electrical Machinery, Other Mineral Fuels & Lubricants and Fertilizers, (Manufactured).
United States of America (USA) including Alaska and Hawaii was the second top source of imports with 10.9 percent share to the total import bill amounting to $574.72 million, higher by 5.0 percent from $547.44 million in September 2011. The expansion on inward value of shipments maybe accounted for the imports of the following commodities like components/devices (semiconductors) and cereals and cereal products specially wheat. Exports to USA amounted to $598.63 million, yielding a two-way trade value of $1.173 billion and a trade surplus for PH of $23.90 million.
Taiwan came in third, accounting for 9.8 percent share of the total import bill in September 2012 with positive growth of 77.0 percent to $515.87 million from $291.45 million. The growth was attributed to the purchases of fuels and lubricants and components/devices (semiconductors). Exports to Taiwan amounted to $182.92 million resulting to a total trade value of $698.79 million and a trade deficit of $332.94 million.
Japan including Okinawa ranked fourth among the top sources of imports for the country accounting for 9.4 percent share of the total import bill in September 2012. It decreased by 21.4 percent from $627.91 million to $493.76 million. On the other hand, exports to Japan amounted to $1.473 billion resulting to a total trade value of $1.967 billion and a trade surplus of $979.55 million were commodities purchased from Japan in September 2012, mostly electronic data processing, components/devices (semiconductors) and organic and inorganic chemicals.
Fifth in rank was Republic of Korea, representing 6.9 percent of the total import bill in September 2012 or an increase of 20.5 percent to $363.56 million from $301.59 million in the same month last year. Mineral, fuels and lubricants and components/devices (semiconductors) were among the highest imported goods from Republic of Korea in September 2012. Exports to Republic of Korea amounted to $179.76 million resulting to a total trade value of $543.32 million and a trade deficit of $183.80 million.
Other major sources of imports for the month of September 2012 were Singapore, $332.22 million; Thailand, $305.41 million; Indonesia, $262.36 million; Saudi Arabia, $247.41 million; and Malaysia including Sabah and Sarawak, $213.01 million.
Payments for imports from the top ten sources for September 2012 amounted to $3.958 billion or 75.1 percent of the total.
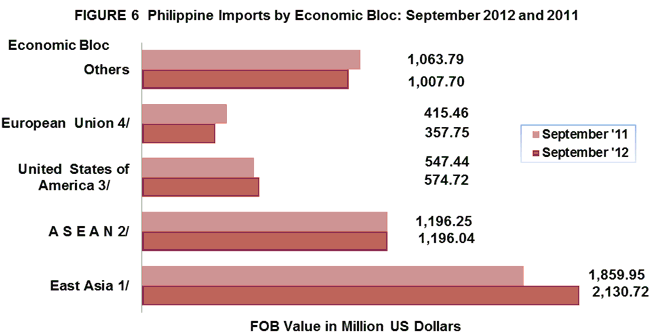
IMPORTS FROM EAST ASIA WORTH $2.131 BILLION
Philippines’ total imports in September 2012 from East Asia accounted for 40.5 percent of the county’s total imports with total payments of $2.131 billion or a positive annual growth of 14.6 percent from September 2011 level of $1.860 billion. Total exports to member-countries of East Asia were valued at $2.727 billion, resulting to a total trade of $4.857 billion and a balance of trade in goods (BOT-G) surplus of $595.81 million.
Imports from ASEAN member-countries recorded 22.7 percent share to total imports. Value of Imports recorded for September 2012 and 2011 were almost the same at $1.196 billion. On the other hand, exports to ASEAN member-countries worth $733.65 million, resulted to a total trade of about $1.930 billion and a trade deficit of $462.39 million.
September 2012 imports from European Union were valued at $357.75 million while exports to member-countries of European Union were worth $443.93 million. These aggregated to a total trade value of $801.68 million and a trade surplus of $86.18 million.
Notes:
1/ - includes China, Hong Kong, Japan, Macau, Mongolia, N, Korea, S. Korea, Taiwan
2/ - includes Brunei Darussalam, Cambodia, Indonesia, Laos, Malaysia, Myanmar, Singapore, Thailand, Vietnam
3/ - includes Alaska and Hawaii
4/ - includes Austria, Belgium, Bulgaria, Cyprus, Czech Republic, Denmark, Estonia, Finland, France, Germany,
Greece, Hungary, Ireland, Italy, Latvia, Lithuania, Luxembourg, Malta, Netherlands, Poland, Portugal,
Romania, Slovakia, Slovenia, Spain, Sweden and UK Great Britain
Technical Notes:
- Adjustments on electronic import statistics are based on the transactions that pass through the Electronic to Mobile (e2m) of the Bureau of Customs (BOC).
- Starting with the 2007 Press Release, analysis and tables are based on the 2004 Philippine Standard Commodity Classification (PSCC) groupings. This is in compliance with NSCB Resolution No. 03, Series of 2005 entitled “Approving and Adopting the 2004 Philippine Standard Commodity Classification” by all concerned government agencies and instrumentalities.
CARMELITA N. ERICTA
Administrator