AUGUST 2013
Year-on-Year and Month-on-Month Growth Rates
of General Retail Price Index: August and July 2013
| All Items | August 2013 | July 2013 | Year-to-date |
|---|---|---|---|
| Year-on-Year | 1.7 | 2.8 | 2.9 |
| Month-on-Month | 0.3 | 0.2 |
Year-on-Year
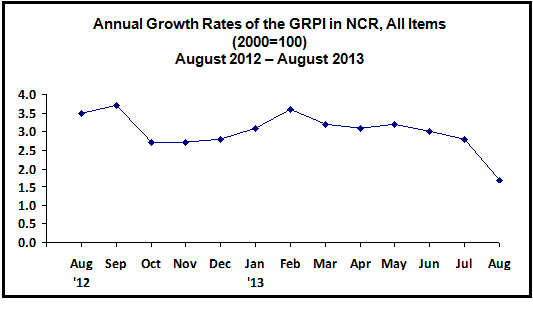
The annual hike in the General Retail Price Index (GRPI) in the National Capital Region (NCR) further decelerated to 1.7 percent in August from 2.8 percent in July. The heavily-weighted food index post a negative rate of 1.0 percent in August from 1.0 percent in July. Moreover, a slower annual gain was noted in beverages and tobacco index, 16.3 percent from 19.0 percent; crude materials inedible except fuels index, 2.6 percent from 2.9 percent; mineral fuels, lubricants and related materials index, 4.1 percent from 7.9 percent; chemicals, including animal and vegetable oils and fats index, 1.2 percent from 1.4 percent; and machinery and transport equipment index, 1.2 percent from 1.4 percent. The manufactured goods classified chiefly by materials and miscellaneous manufactured articles indices retained their last month’s rates of 1.7 percent and 3.1 percent, respectively.

By Commodity Group, Month-on-Month
Measured from a month ago level, the growth in the GRPI for all items in NCR advanced 0.3 percent in August from 0.2 percent in July.
The food index rose 0.7 percent from zero growth. This can be attributed to the increase in the prices of fish, rice, corn, fruits, vegetables, milk, sugar and poultry feeds.
The beverages and tobacco index went up at a slower rate of 0.1 percent from 0.3 percent as prices of selected softdrinks and cigarette were on the uptrend.
Price add-ons in men’s selected outer garments, women’s and boys rubber slippers, boy’s leatherette slippers and women’s wrist watch raised the miscellaneous manufactured articles index 0.2 percent from zero growth.
Price hikes in LPG, diesel fuel and kerosene were offset by the price decline in gasoline, engine oil and lubricating oil, thus the index of mineral fuels, lubricants and related materials eased to 1.1 percent from 2.4 percent.
No movement were seen in the indices of crude materials, inedible except fuels and chemicals, including animal and vegetable oils and fats as they recorded zero growth during the month in review from 0.1 percent respectively. Likewise, the index of manufactured goods classified chiefly by materials had a zero growth from 0.2 percent.
The machinery and transport equipment index eased to -0.1 percent from 0.2 percent due to price decreases in safety switch and fluorescent tubes.
