
FEBRUARY 2014
Year-on-Year and Month-on-Month Growth Rates
of General Retail Price Index: February 2014 and January 2014
| All Items | February 2014 | January 2014 | Year-to-date |
|---|---|---|---|
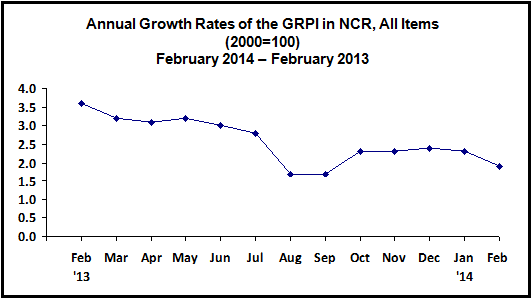
| Year-on-Year | 1.9 | 2.3 | 2.1 |
| Month-on-Month | -0.1 | 0.2 |
Year-on-Year
The annual growth in the General Retail Price Index (GRPI) in the National Capital Region (NCR) further slowed down to 1.9 percent in February from 2.3 percent in January. The annual gain in the heavily-weighted food index eased to 2.8 percent in February from 3.3 percent in January; beverages and tobacco index, 4.2 percent from 4.9 percent; mineral fuels, lubricants and related materials index, 1.8 percent from 4.4 percent; and manufactured goods, classified chiefly by materials index, 1.2 percent from 1.4 percent. On the other hand, higher annual hikes were correspondingly noted in the indices of machinery and transport equipment and miscellaneous manufactured articles at 0.7 percent and 1.8 percent from their respective last month’s rates of 0.6 percent and 1.3 percent. The indices of crude materials, inedible except fuels and chemicals, including animal and vegetable oils and fats retained their previous month’s rates of 0.1 percent and 1.1 percent, respectively.
By Commodity Group, Month-on-Month
The GRPI for all items in NCR went down by 0.1 percent in February from 0.2 percent growth in January.
The 0.9 percent drop in the heavily-weighted food index was attributed to the decreases in the prices of fish, vegetables, eggs and sugar. The sufficient volume of deliveries of vegetables in NCR markets and the favorable weather conditions prevailing during the month allowing more fishing trips which resulted to higher volume of fish catch contributed largely to the lower prices of vegetables and fish during the month in review.
Price reductions in LPG and kerosene effected a 0.1 percent decline in the index of mineral fuels, lubricants and related materials.
The monthly increment in chemicals, including animal and vegetable oils and fats index eased to 0.1 percent from 0.2 percent. Price upticks in medical and pharmaceutical preparations and cosmetics, soap and other washing and cleaning compounds were tempered by the price cuts in selected paints and film for colored prints.
The beverages and tobacco index went up 0.7 percent due to mark-ups in the prices of liquors, wines, softdrinks and selected cigarettes.
The machinery and transport equipment index inched up 0.1 percent from -0.3 percent as wiring devices and selected electrical appliances were priced higher during the month.
A 0.6 percent gain was noted in the index for miscellaneous manufactured articles. This was brought about by the upward price adjustments in selected plumbing fixtures and fittings, cast iron bed, undergarments and footwear items.
No movement was seen the indices of crude materials inedible except fuels and manufactured goods classified chiefly by materials as they exhibited zero growth during the month from 0.6 percent and 0.2 percent, respectively.