MARCH 2013
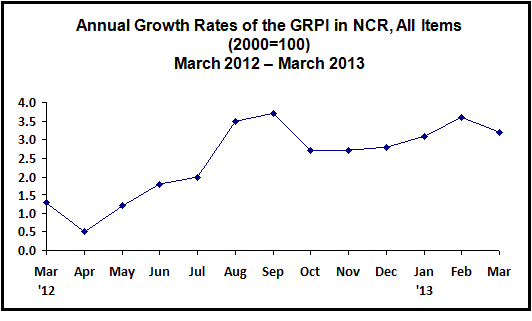
Year-on-Year and Month-on-Month Growth Rates
of General Retail Price Index: March and February 2013
| All Items | March 2013 | February 2013 | Year-to-date |
|---|---|---|---|
| Year-on-Year | 3.2 | 3.6 | 3.3 |
| Month-on-Month | -0.1 | 0.3 |
Year-on-Year
The annual increment in the General Retail Price Index (GRPI) in the National Capital Region (NCR) eased to 3.2 percent in March from 3.6 percent in February. The annual change of mineral fuels, lubricants and related materials index dropped by 4.3 percent in March from 0.5 percent in February. Moreover, slowdowns in the annual growths were recorded in the following indices: food, 2.0 percent from 2.1 percent; crude materials, inedible except fuels, 9.9 percent from 10.8 percent; chemicals, including animal and vegetable oils and fats, 2.4 percent from 2.8 percent; manufactured goods classified chiefly by materials, 1.8 percent from 2.0 percent; and machinery and transport equipment, 3.6 percent from 4.0 percent. On the other hand, higher annual rates were noted in beverages and tobacco and miscellaneous manufactured articles indices at 19.7 percent and 4.2 percent, respectively from their corresponding previous month’s rates of 19.3 percent and 4.1 percent.

By Commodity Group, Month-on-Month
On a monthly basis, the GRPI in NCR decreased by 0.1 percent in March from 0.3 percent growth in February.
A negative rate of 0.2 percent was still registered in the heavily- weighted food index from -0.4 percent. This was due to downward price adjustments in selected foodstuffs such as chicken, eggs, fish, corn and sugar.
The index of crude materials, inedible except fuels went down by 0.5 percent from zero growth due to price cuts in gravel and sand.
Price reductions in gasoline, LPG, diesel fuel, engine oil and kerosene effected a 1.9 percent decline in mineral fuels, lubricants and related materials index.
Price gains in liquors, wines and cigarettes were noted during the month. Thus, beverages and tobacco index moved up by 0.9 percent.
Price add-ons in selected paints and medicinal and pharmaceutical products resulted to a 0.1 growth in chemicals, including animal and vegetable oils and fats index.
The manufactured goods, classified chiefly by materials index inched up by 0.2 percent from 0.1 percent as prices of corrugated GI sheets went up during the month.
The machinery and transport materials index advanced by 0.1 percent from zero growth. This can be attributed to the price upticks in other wiring devices.
Upward price adjustments in faucet, sala set and other ready-made garments such as men’s brief, boy’s socks and selected footwear were observed in March. These raised the miscellaneous manufactured articles index by 0.2 percent from 0.1 percent.
