SEPTEMBER 2017
GENERAL RETAIL PRICE INDEX IN THE NATIONAL CAPITAL REGION
(2000=100)
Year-on-Year and Month-on-Month Growth Rates
| All Items | September 2017 | August 2017 | September 2016 | Year-to-date |
|---|---|---|---|---|
| Year-on-Year | 3.2 | 3.3 | 3.0 | 3.8 |
| Month-on-Month | 0.6 | 0.3 | 0.7 |
Year-on-Year
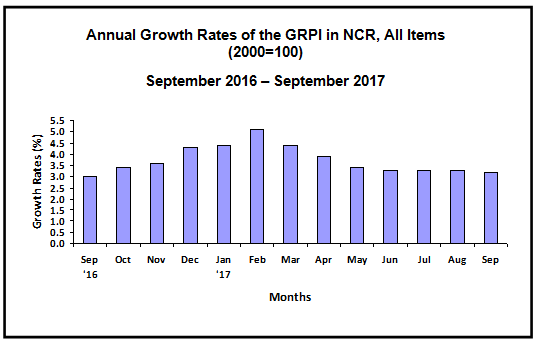
The annual increase of the General Retail Price Index (GRPI) in the National Capital Region (NCR) slowed down to 3.2 percent in September 2017. Its annual rate in August 2017 was pegged at 3.3 percent and in August 2016, 3.0 percent. The annual gain of food index was slower at 5.4 percent; machinery and transport equipment index, 0.5 percent; and miscellaneous manufactured articles index, 0.6 percent. Meanwhile, the index of mineral fuels, lubricants and related materials, continued to register a double-digit annual growth at 11.0 percent in September. Moreover, higher annual increments were observed in the indices of beverages and tobacco at 4.7 percent; crude materials, inedible except fuels, 3.4 percent; and manufactured goods classified chiefly by materials, 1.4 percent. That for chemicals, including animal and vegetable oils and fats index remained at 1.7 percent for four consecutive months now (see Table 2).

By Commodity Group, Month-on-Month
On a monthly basis, the GRPI in NCR went up by 0.6 percent in September. In the previous month, its growth was registered at 0.3 percent.
The heavily-weighted food index picked up by 1.3 percent due to higher prices of beef, milk, rice, loaf bread, fruits, vegetables, raw peanuts, powdered tonic drink, coffee, cooking oil, and fish sauce.
Price hikes in petroleum products such as gasoline, LPG, diesel, kerosene and engine oil resulted to a 2.5 percent increase in its group’s index for mineral fuels, lubricants and related materials.
The index of beverages and tobacco inched up by 0.1 percent during the month. Price increments were noted in selected liquors and wines, softdrinks and cigarettes.
The growth in the index of crude materials, inedible except fuels slowed down to 0.1 percent as lower monthly increments in the prices of gravel and sand were noted during the period.
Similarly, the index of manufactured goods classified chiefly by materials, moved up at a slower pace of 0.1 percent. Higher prices in lawanit, bond paper, folder, pad paper, textile yarn fabrics, hollow blocks, steel bars, G.I. pipes and common wire nails were tempered by the declines in the prices of lumber and aluminum foil.
Upticks in the prices of vitamins, medicine, bath soap, cleanser, bleacher, insecticides, and some items in cosmetics and toilet preparations were observed during the month. Hence, the index of chemicals, including animal and vegetables oils and fats rose by 0.1 percent.
Machinery and transport equipment index dropped by 0.1 percent due to price reductions in electric lamps and selected electrical appliances.
Miscellaneous manufactured articles index exhibited a zero growth during the period. Prices of selected clothing items went up during the month. These were however, offset by the decreases in the prices of selected furnitures, clothing items, office and school supplies.
