
GENERAL WHOLESALE PRICE INDEX (GWPI)
(1998=100)
Year-on-Year Changes in Percent, All Items (May 2017 - May 2018)
Year/Month | Philippines | Luzon | Visayas | Mindanao |
|---|---|---|---|---|
| 2018 | ||||
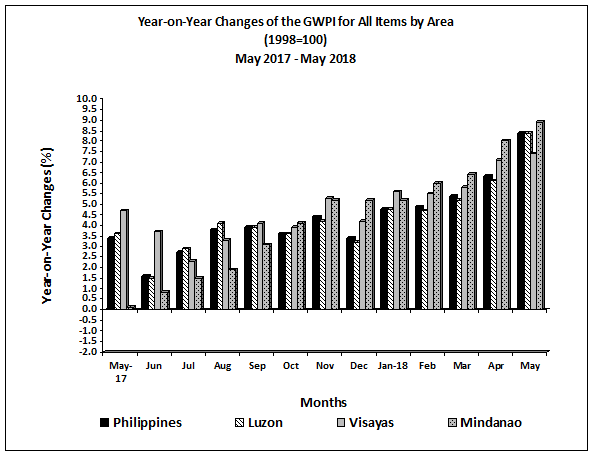
| May | 8.4 | 8.4 | 7.4 | 8.9 |
| April | 6.3 | 6.1 | 7.1 | 8.0 |
| March | 5.4 | 5.2 | 5.8 | 6.4 |
| February | 4.9 | 4.7 | 5.5 | 6.0 |
| January | 4.8 | 4.8 | 5.6 | 5.2 |
| 2017 | 4.4 | 4.6 | 4.3 | 2.7 |
| December | 3.4 | 3.2 | 4.2 | 5.2 |
| November | 4.4 | 4.2 | 5.3 | 5.2 |
| October | 3.6 | 3.6 | 3.9 | 4.1 |
| September | 3.9 | 3.9 | 4.1 | 3.1 |
| August | 3.8 | 4.1 | 3.3 | 1.9 |
| July | 2.7 | 2.9 | 2.3 | 1.5 |
| June | 1.6 | 1.5 | 3.7 | 0.8 |
| May | 3.4 | 3.6 | 4.7 | 0.1 |
• Year-on-Year
The year-on-year change of the General Wholesale Price Index (GWPI) at the national level went up by 8.4 percent in May 2018. In the previous month, the annual rate was recorded at 6.3 percent and in May 2017, 3.4 percent. Compared with the annual rates in April 2018, annual increases in May 2018 were higher in the indices of food at 3.3 percent; mineral fuels, lubricants and related materials, 37.3 percent; and miscellaneous manufactured articles, 1.3 percent. On the other hand, annual rates decreased in the indices of crude materials inedible except fuels by 19.3 percent and chemicals including animal and vegetable oils and fats by 0.2 percent. The rest of the commodity groups retained their previous month’s rate (see Table 1.1).
> The annual growth of the GWPI in Luzon likewise accelerated by 8.4 percent in May 2018. Its annual rate in April 2018 was posted at 6.1 percent and in May 2017, 3.6 percent. Annual add-ons in the indices of mineral fuels, lubricants and related materials were higher at 38.5 percent and miscellaneous manufactured articles, 1.3 percent than their annual growths in April 2018. The annual adjustment in food index also rose by 2.2 percent this month from only 0.04 percent annual growth in the previous month. Meanwhile, annual rates dropped in the indices of crude materials, inedible except fuels by 20.9 percent and chemicals including animal and vegetable oils and fats by 1.5 percent from their previous month’s annual growths. Annual changes for the rest of the commodity groups remained at their previous month’s rates (see Table 2.1).
> In Visayas, the annual rate of the GWPI picked up by 7.4 percent in May 2018. Its annual changes were recorded at 7.1 percent in April 2018 and 4.7 percent in May 2017. Relative to previous month’s annual increases, higher rates were posted in the indices of mineral fuels, lubricants and related materials at 30.0 percent; chemicals including animal and vegetable oils and fats, 8.0 percent; and manufactured goods classified chiefly by materials, 0.8 percent. Slower annual increases were, however, observed in the indices of food at 4.5 percent and machinery and transport equipment, 1.3 percent. The index of crude materials, inedible except fuels remained on downtrend as its annual rate decreased by 10.8 percent. Movement in beverages and tobacco index was constant at 21.7 percent and miscellaneous manufactured articles index, 0.1 percent (see Table 3.1).
> Annual increment of GWPI in Mindanao was higher at 8.9 percent in May 2018 than in April 2018. In the previous month, its annual rate was posted at 8.0 percent and in May 2017, 0.1 percent. Compared to the annual rates in the previous month, annual mark-ups were higher in the indices of food at 9.7 percent; mineral fuels, lubricants and related materials, 24.0 percent; and chemicals including animal and vegetable oils and fats, 2.8 percent. On the other hand, the annual gains in the indices of beverages and tobacco were slower at 29.4 percent and miscellaneous manufactured articles, 1.8 percent. The index of crude materials, inedible except fuels was still on a downtrend as it exhibited an annual drop of 1.8 percent. Other commodity groups retained their previous month’s rate (see Table 4.1).
• By Commodity Group, Month-on-Month
On a monthly basis, the GWPI at the national level increased by 1.3 percent in May 2018. In April 2018, its monthly rate was recorded at 0.9 percent. The indices of mineral fuels, lubricants and related materials went up by 5.1 percent and food, 0.7 percent. In addition, from less than 0.05 percent (0.04%) growth in the previous month, the index of miscellaneous manufactured articles picked up by 0.4 percent. Meanwhile, a slower uptick was seen in the index of manufactured goods classified chiefly by materials at 0.1 percent. Declines were registered in the indices of crude materials, inedible except fuels at 3.0 percent and chemicals including animal and vegetable oils and fats, 0.7 percent. The index of beverages and tobacco posted a minimal growth (0.01%) while that for machinery and transport equipment had zero growth (see Table 1.2).
- Price hikes in petroleum products such as gasoline, diesel oil, kerosene, bunker fuel, crude petroleum oil and LPG pushed up the index of mineral fuels, lubricants and related materials in Luzon by 5.2 percent. Similarly, the group’s index in Visayas rose by 2.1 percent due to upward adjustments in the prices of gasoline, kerosene and LPG. Increments in the prices of gasoline, diesel oil, lubricating oil and LPG in Mindanao also raised its group’s index by 6.0 percent. For the Philippines, the group’s index gained by 5.1 percent.
- The food index in Luzon picked up by 1.2 percent in May 2018 as liveweight chicken, pork, canned fish, fruits, vegetables, sugar and cooking oil were priced higher during the period. Moreover, prices of unprocessed animal feeds, cocoa products and desiccated coconut also went up in the area during the period. On the other hand, prices of eggs, fish, rice, fruits, desiccated coconut and monosodium glutamate pushed down the food index in Visayas by 1.0 percent. In Mindanao, the group’s index also decreased by 0.6 percent due to downward price adjustments in fish, corn grain, rice, flour, selected cereal preparations, bakery products, cocoa products and starch. The food index for the Philippines expanded by 0.7 percent.
- A 0.4 percent uptick in miscellaneous manufactured articles index in Luzon can be attributed to higher prices in selected ready-made clothing items, office supplies and matches. Similarly, the group’s index in Mindanao inched up by 0.1 percent brought about by increases in the prices of columnar pad, ledger books and matches. In Visayas, the index had zero growth. At the national level, the group’s index advanced by 0.4 percent.
- The index of manufactured goods classified chiefly by materials in Mindanao went up by 0.3 percent due to higher prices of selected construction materials and paper products. For Luzon, prices of G.I. sheets and barbed wires went down during the month. Thus, the group’s index in the area dropped by 0.1 percent. The group’s index in Visayas, however, had zero growth during the period. The group’s index at the country level rose by 0.1 percent.
- The index of chemicals including animal and vegetable oils and fats in Luzon fell by 0.9 percent as coconut oil was priced lower during the month than in previous month. On the contrary, higher prices were noted in coconut oil and selected medical and pharmaceutical preparations in Visayas. Hence, the group’s index in the area picked up by 0.4 percent. In Mindanao, the group’s index increased by 0.3 percent due to higher prices in fertilizer and selected medical and pharmaceutical preparations. At the national level, the group’s index declined by 0.7 percent.
- The index of crude materials, inedible except fuels in Luzon decreased by 3.4 percent which was brought about by lower prices of copra and abaca fiber. On the other hand, higher prices of copra in Visayas pushed up the group’s index in the area by 0.3 percent. Similarly, the group’s index in Mindanao went up by 0.2 percent due to the increments in the prices of sand and gravel. At the country level, the group’s index dropped by 3.0 percent.
- Upward price adjustments in liquors and cigarettes during the month resulted to a 0.1 percent gain in beverages and tobacco index in Mindanao. The group’s index in Luzon and Visayas, however, did not change during the period. At the national level, the group’s index recorded a low growth of 0.01 percent.
- The index for machinery and transport equipment in the four areas registered zero growth this month (see Tables 1.2, 2.2, and 3.2).
See more at the General Wholesale Price Index main page.
| Attachment | Size |
|---|---|
|
|
108.37 KB |
|
|
115.16 KB |
|
|
88.12 KB |
|
|
123.21 KB |
|
|
123.01 KB |
|
|
112.3 KB |