
Merchandise Export Performance : April 2006 ( Preliminary )*
|
|||||||||||||||||||||||||||||||||||||||||||||||
|
Top 10 Philippine Exports for All Countries: April 2006 p |
|||
|
Gainers |
Losers |
||
|
Gold |
342.0 |
Metal Components |
(34.3) |
|
Cathodes and Sections of Cathodes, of Refined Copper |
151.3 |
Coconut Oil |
(10.9) |
|
Woodcrafts and Furniture |
80.0 |
||
|
Petroleum Products |
79.2 |
||
|
Electronic Products |
19.7 |
||
|
Articles of Apparel and Clothing Accessories |
19.2 |
||
|
Bananas (Fresh) |
13.3 |
||
|
Ignition Wiring Set and Other Wiring Sets used in Vehicles, Aircrafts and Ships |
12.0 |
||
* Does not include transactions that passed through Automated Export Documentation System (AEDS), Mactan.
p - preliminary
r - revised
Merchandise exports register 18.7 percent increase
Export earnings in April 2006 went up by 18.7 percent to $3.852 billion from $3.246 billion during the same period a year earlier. The double-digit increase was recorded since February of the current year.
Receipts from merchandise exports during January to April 2006 gained 15.2 percent to $14.750 billion from $12.808 billion during the same period of the previous year.
Electronic products exports up by 19.7 percent
Electronic products, accounting for 65.2 percent of the aggregate export revenue in April, exhibited an increase of 19.7 percent to $2.511 billion from $2.097 billion a year ago.
Among the major groups of electronic products, components/devices (Semiconductors) got the major share with 52.1 percent to total exports. Semiconductors posted a positive growth at 29.6 percent to $2.055 billion from $1.548 billion during the same month in 2005. The other electronic products group that showed inceases were Office Equipment at 64.1 percent with a share of 0.54 percent. Telecommunication at 180.6 percent with a share of 0.47 percent,and Medical/Industrial Instrumentation at 26.6 percent with a share of 0.01 percent to total exports.
Articles of apparel and clothing accessories remained as the country’s second top earner with a combined share of 4.0 percent and an aggregate receipt of $153.44 million or 19.2 percent higher than $128.68 million a year earlier. This was brought about by the bulk order of men's wear, brassieres as well as blouses and shirts for women.
Cathodes and sections of cathodes, of refined copper, ranked third with total revenue of $100.52 million reflecting a 151.3 percent increment from $40.0 million during the same period of 2005.
Coconut oil, ranked fourth with sales amounting to $82.45 million or a year-on-year decrease of 10.9 percent from $92.55 million.
Revenue from petroleum products gained 79.2 percent to $74.65 million from $41.65 million. This can be attributed to the higher demand in fuel oils and lubricating greases.
Rounding up the list of the top exports for the month of April 2006 were woodcrafts and furniture, with sales amounting to $65.98 million or a year-on-year growth of 80.0 percent from $36.65 million, resulting from higher demand in other builders' joinery and carpentry of wood and parts of furniture; ignition wiring set and other wiring sets used in vehicles, aircrafts and ships (consists only of electrical wiring harness for motor vehicles), $57.0 million;bananas (fresh) $34.27 million; metal components, $23.08 million; and gold $20.54 million.
Total receipts from the top ten exports reached $3.123 billion, or 81.1 percent of the total exports.
Fig. 1 Philippine Top Exports: April 2006 and 2005
(F.O.B. Value in Million US Dollars)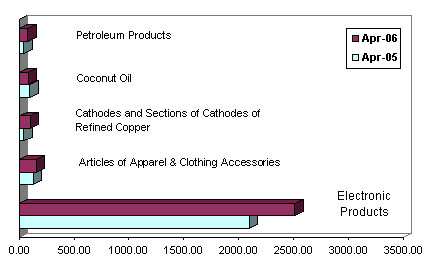
Exports of manufactured goods increase by 16.8 percent
Accounting for 86.2 percent of the total receipts, exports of manufactured goods was $3.319 billion with a 16.8 percent growth from $2.843 billion during the same period of 2005.
Earnings from all agro-based products combined for $218.48 million or 5.7 percent of the total export revenue. Compared to last year, aggregate receipt for this commodity group increased by 2.4 percent from $213.34 million.
Income from mineral products moved up by 109.9 percent to $166.47 million from $79.30 million while receipts from exports of petroleum products improved by 79.2 percent to $74.66 million from $41.65 million.
Special transactions registered earnings of $71.59 million, while forest products contributed $1.31 million.
Fig. 2 Philippine Exports by Commodity Group: April 2006 and 2005
(F.O.B. Value in Million US Dollars)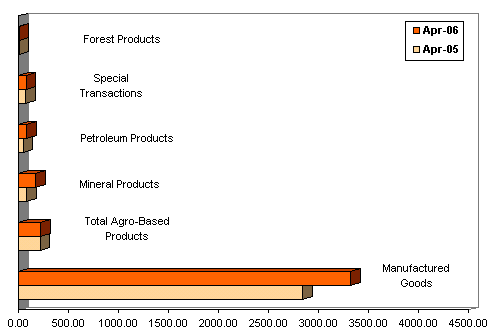
Exports to Netherlands account for 19.1 percent
Exports to Netherlands valued at $734.41 million, accounted for 19.1 percent of the country's aggregate income for the month. Receipts accelerated by as much as 118.5 percent from last year's reported figure of $336.06 million.
Japan followed with a 16.6 percent share. With earnings of $640.58 million, exports to Japan grew by 6.3 percent from $602.78 million.
United States emerged as the third biggest market for the month as shipments of local goods amounted to $612.82 million or 15.9 percent of the total. Exports gained by 14.9 percent from $533.27 million compared to the same period of 2005.
Singapore accounted for 7.7 percent of the total revenue, with $297.34 million reflecting a 32.4 percent increment from $224.56 million during the same month a year ago.
Other top markets for April 2006 were: People's Republic of China, $287.81 million; Hong Kong, $271.26 million; Malaysia, $184.17 million; Germany, $122.04 million; Republic of Korea, $120.57 million; and Taiwan, $119.86 million.
Total export receipts from RP's top ten markets for the month of April amounted to $3.391 billion or 88.0 percent of the total.
Fig. 3 Philippine Top Exports by Country: April 2006
(F.O.B. Value in Million US Dollars)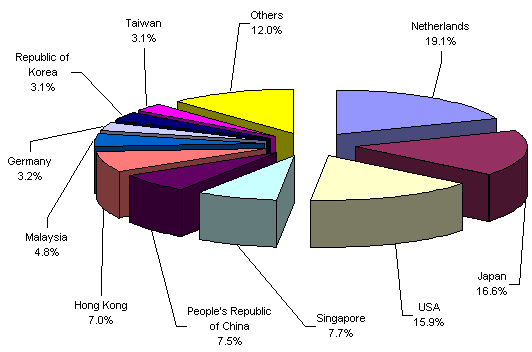
|
(Sgd.) CARMELITA N. ERICTA |
Source: Economic Indices and Indicators Division
Industry and Trade Statistics Department
National Statistics Office
Manila, Philippines