
MERCHANDISE EXPORT PERFORMANCE*
August 2012
(Preliminary)

* Includes transactions that passed through Automated Export Documentation System (AEDS) and Electronic to Mobile (E2M).
p - preliminary
r - revised
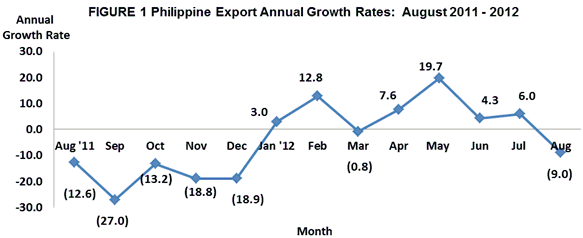
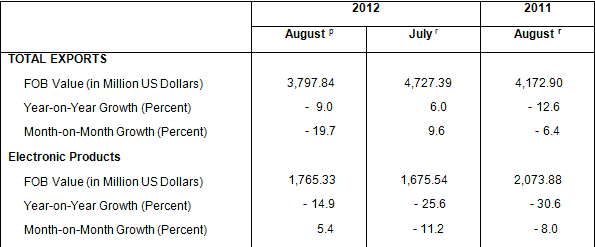
MERCHANDISE EXPORTS FOR AUGUST 2012 DOWN BY 9.0 PERCENT
Export earnings in August 2012 went down by 9.0 percent to $3.798 billion from $4.173 billion recorded in August 2011. The decline was brought about by the decrease in value of shipments in the following commodities: Articles of Apparel and Clothing Accessories, Coconut Oil, Bananas (Fresh), Electronic Products, Pineapple and Pineapple Products and Ignition Wiring Set and Other Wiring Sets Used in Vehicles, Aircrafts and Ships. Similarly, on a monthly basis, it fell by 19.7 percent from $4.727 billion posted in July 2012. Total volume of outward shipments in August 2012 showed a decrease of 56.7 percent year-on-year and 72.6 percent contraction compared to last month’s outward shipments. However, cumulative merchandise exports for the first eight months of 2012 recorded a positive growth of 5.4 percent to $35.283 billion from $33.479 billion posted during the same period of 2011.
ELECTRONIC PRODUCTS DECREASE BY 14.9 PERCENT
Electronic Products emerged as the country’s top export with total receipts of $1.765 billion. It accounted for 46.5 percent of the total exports revenue in August 2012. However, it went down by 14.9 percent from $2.074 billion registered in August 2011. Similarly, outward shipments were also down by 0.3 percent compared to same month last year’s recorded shipments. Components/Devices (Semiconductors), which comprised 37.1 percent of the total exports had the biggest share among the major groups of electronic products with export earnings worth $1.410 billion, registered a decrease of 10.5 percent from $1.576 billion in August 2011. On a monthly basis, growth of electronic products as well as semiconductors showed a positive growth of 5.4 percent and 4.9 percent respectively. Meanwhile, volume of outward shipments of semiconductors grew by 2.5 percent compared to same period a year ago.
Woodcrafts and Furniture with 5.4 percent share in the total value of exports for August 2012 was recorded as the country’s second top export with revenue valued at $205.65 million. This figure exhibited a growth of 23.9 percent compared from its year ago level of $165.95 million. On the other hand, volume of this product also grew by 50.2 percent compared to the same period last year.
Metal Components followed as the third top export earner in August 2012 with total receipts of $138.55 million or a share of 3.7 percent to total exports revenue. It expanded by 100.2 percent, the highest annual increase among the top ten exports, compared to same month a year ago level of $69.22 million. Outward shipment of this product showed also an expansion of 15.3 percent compared to its year ago recorded shipment.
Ranked fourth in August 2012 and contributing 2.7 percent share to the total export receipts were Ignition Wiring Set and Other Wiring Sets Used in Vehicles, Aircrafts and Ships consisting only of electrical wiring harness for motor vehicles with earnings amounting to $103.84 million. It slightly went down by 0.9 percent from $104.79 million registered in August 2011. Furthermore, volume of shipments of this commodity showed a 1.9 percent increase compared to last year same month period.
Articles of Apparel and Clothing Accessories with 2.0 percent share to the total export receipts ranked fifth with value posted at $77.31 million. It decreased by 55.4 percent from $173.44 million recorded in August 2011. Similarly, volume of outward shipments decreased by 47.7 percent compared to it’s a year ago volume of shipment.
Rounding up the list of the top ten exports for the month of August 2012 were Coconut Oil including crude and refined with export revenue of $47.18 million decreasing by 50.5 percent; Pineapple and Pineapple Products with export receipts of $35.54 million, losing by 4.2 percent; Copper Concentrates with export earnings of $35.02 million increasing by 38.5 percent; Bananas (Fresh) with recorded sales of $29.83 million declining by 15.4 percent; and Gold, extracted from copper ores and concentrates with proceeds billed at $28.67 million rising by 40.6 percent.
Total receipts from the top ten exports reached $2.467 billion, or 65.0 percent of the total exports.

EXPORTS OF MANU
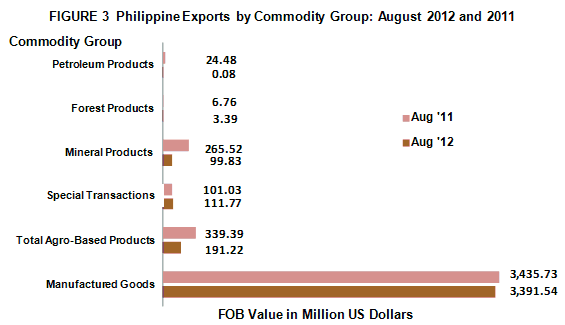
Accounting for 89.3 percent of the total export receipts in August 2012, value of outward shipments of Manufactured Goods was estimated at $3.392 billion, representing a decrease of 1.3 percent from $3.436 billion recorded in August 2011. Outward shipments in terms of gross kilos did show decline of 30.0 percent compared to shipment in August 2011. Similarly, it went down by 15.7 percent compared to recorded value of $4.025 billion in July 2012. However, volume of shipment grew by 13.8 percent month-on-month.
Income from Total Agro-Based Products, comprising 5.0 percent share of the total exports revenue in August 2012, went down by 43.7 percent from $339.39 million to $191.22 million. Moreover, it contracted by 45.7 percent from $351.96 million in July 2012. This product also showed a contraction in terms of volume with a negative 19.4 percent year-on-year change and negative 25.4 percent month-on-month change. The drop was mainly due to the decline in both the value and volume of export items like sugar and sugar products, fruits and vegetables and other agro-based products.
Earnings from Mineral Products with a share of 2.6 percent reached $99.83 million. It went down by 62.4 percent from $265.52 million in August 2011. However, export receipts from Special Transactions which consist of commodities like gifts, donations, machinery and equipment returned to the country, replacement of returned goods and the likes reflecting 2.9 percent share was higher by 10.6 percent to $111.77 million from $101.03 million in August 2011. However, shipment of products categorized under special transactions did show a decrease of 40.8 percent compared to August 2011 recorded volume of outward shipments.
Forest Products accounting for 0.1 percent share of the total exports revenue decreased by 49.8 percent from $6.76 million in August 2011 to $3.39 million. Moreover, Petroleum Products with almost 0.0 percent share was down by 99.7 percent from $24.48 million in August 2011 to $0.08 million in August 2012. Similarly, forest and petroleum products outward shipments had a negative growth of 41.4 percent and 96.6 percent, respectively compared to same period last year.
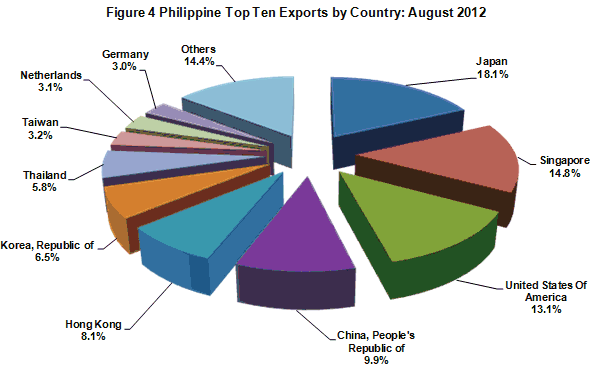
EXPORTS TO JAPAN ACCOUNTS FOR 18.1 PERCENT
Japan including Okinawa getting 18.1 percent share of the total exports for August 2012 emerged as the country’s top destination of exports with revenue amounting to $686.71 million. It was higher by 4.6 percent from $656.28 million recorded a year ago. The export items to Japan consist mainly of woodcrafts and components/devices (semiconductors).
Singapore with 14.8 percent share to total exports followed as the second top market of the country for August 2012 with export earnings worth $561.99 million. This represented an increase of 63.6 percent from $343.57 million reported a year earlier. Most of the exported products to Singapore were components/devices (semiconductors), machinery and transport equipment, other manufactures and products exported under special transactions.
United States of America (USA) including Alaska and Hawaii accounting for 13.1 percent share to total exports came in third with shipments amounting to $499.27 million. Compared to the same month a year ago, however, its value contracted by 18.7 percent from $614.25 million. Products exported to USA comprised mostly of electronics.
People’s Republic of China ranked fourth in August 2012 with $376.55 million or 9.9 percent share of the total exports. The amount dropped by 42.0 percent from last year’s amount of $649.46 million.
Fifth in rank and representing 8.1 percent share to total exports was Hong Kong with export earnings worth $306.97 million which recorded a drop of 10.2 percent from $341.95 million posted in August 2011.
Other top ten markets for August 2012 were Republic of Korea, $246.13 million; Thailand, $218.54 million; Taiwan, $120.36 million; Netherlands, $119.03 million; and Germany, $113.67 million.
Total export receipts from the country’s top ten markets for the month of August 2012 amounted to $3.249 billion or 85.6 percent of the total.
EXPORTS TO EAST
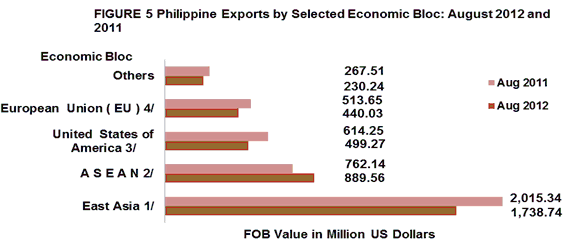
The merchandise exports of the Philippines to East Asia (China, Hong Kong, Japan, Macau, Mongolia, North Korea, South Korea and Taiwan) in August 2012 accounted for 45.8 percent share of total exports, amounting to $1.739 billion or a decrease of 13.7 percent from its August 2011 figure of $2.015 billion.
Exports to ASEAN member-countries, accounting for 23.4 percent share to total merchandise exports in August 2012, reached $889.56 million and grew by 16.7 percent from $762.14 million recorded in August 2011.
Merchandise exports to European Union (EU), sharing 11.6 percent to total merchandise exports in August 2012, was valued at $440.03 million. It dropped by 14.3 percent from $513.65 million posted in August 2011.
Notes:
1/ - includes China, Hong Kong, Japan, Macau, Mongolia, N, Korea, S. Korea, Taiwan
2/ - includes Brunei Darussalam, Cambodia, Indonesia, Laos, Malaysia, Myanmar, Singapore, Thailand, Vietnam
3/ - includes Alaska and Hawaii
4/ - includes Austria, Belgium, Bulgaria, Cyprus, Czech Republic, Denmark, Estonia, Finland, France, Germany, Greece, Hungary, Ireland, Italy, Latvia, Lithuania, Luxembourg, Malta, Netherlands, Poland, Portugal, Romania, Slovakia, Slovenia, Spain, Sweden and UK Great Britain
Technical Note:
Starting with the February 2007 Press Release, analysis and tables are based on the 2004 Philippine Standard Commodity Classification (PSCC) groupings. This is in compliance with NSCB Resolution No. 03, Series of 2005 entitled “Approving and Adopting the 2004 Philippine Standard Commodity Classification” by all concerned government agencies and instrumentalities.
CARMELITA N. ERICTA
Administrator
Source: Foreign Trade Statistics Section
Industry and Trade Statistics Department
National Statistics Office
Manila, Philippines