
YEAR 2000 EXPORT REVENUE GROWS BY 8.7 PERCENT
Total receipts from merchandise export for the period January to December 2000 grew by 8.7 percent to $38.077 billion from $35.037 billion in 1999.
For the month of December, total receipts increased by 18.8 percent to $3.495 billion compared to $2.944 billion in 1999.
Fig. 1. Philippine Export by Month: 2000
( F.O.B. Value in Million US Dollar )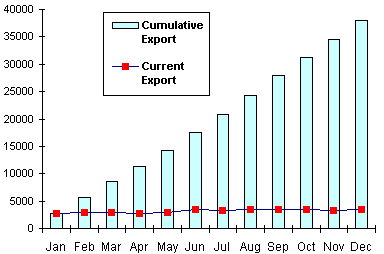
ELECTRONICS COMPONENTS INCREASE BY 15.6 PERCENT
Electronics Components, accounting for 59.2 percent of the aggregate receipt, led the top earners for the month of December 2000. Value of shipments worth $2.070 billion increased by 15.6 percent from $1.790 billion in 1999.
Articles of Apparel and Clothing Accessories ranked second with a 7.5 percent share and reported sales of $262.64 million which was 19.3 percent higher than $220.23 million a year ago.
The third top earner consisted of Woodcrafts and Furniture with sales of $74.62 million which was a 56.3 percent increase from $47.73 million last year.
Earnings from Coconut Oil worth $63.81 million went up by 108.4 percent from $30.62 million a year ago.
Ignition Wiring Set and Other Wiring Sets Used in Vehicles, the fifth biggest earner, reported sales amounting to $50.54 million, which was an increase of 22.2 percent over $41.34 million in 1999.
Receipts from Petroleum Products grew by 339.6 percent to $36.76 million from $8.36 million in 1999.
Completing the list of the top exports for December 2000 were Other Products Manufactured from Materials Imported on Consignment Basis, $35.00 million; Cathodes & Sections of Cathodes, Of Refined Copper, $28.92 million Metal Components, $27.01 million; and Bananas (Fresh), $26.26 million.
Combined revenue from the top ten exports for December amounted to $2.676 billion, or 76.6 percent of the total.
Fig. 2. Philippine Top Exports in December: 1999 & 2000
( F.O.B. Value in Million US Dollar )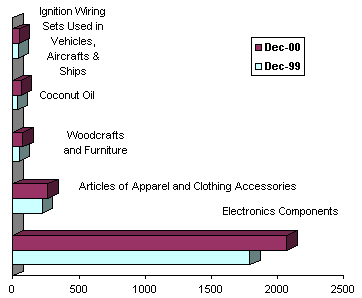
REVENUES FROM MANUFACTURED GOODS ROSE BY 18.4 PERCENT
Manufactured Goods comprised almost 90.0 percent of total exports. Receipts from this major export group reached $3.144 billion which was up by 18.4 percent over $2.656 billion a year earlier.
Combined sales from Agro-Based Products and Other Agro-Based Products, netted $172.05 million. Compared to last year, aggregate revenue increased by 40.1 percent from $122.82 million.
Exports of Petroleum Products rose by 339.6 percent to $36.76 million while Mineral Products declined by 21.1 percent to $68.85 million.
Special Transactions amounting to $71.46 million increased by 9.0 percent from $65.58 million last year.
Fig. 3. Philippine Exports by Commodity Group in December: 1999 & 2000
( F.O.B. Value in Thousand US Dollar )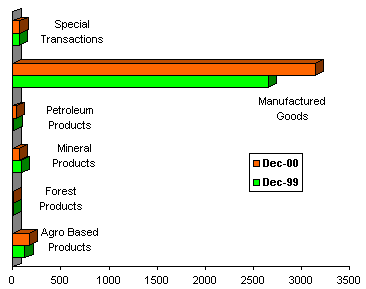
US CORNERS 34.2 PERCENT OF DECEMBER EXPORT REVENUE
Accounting for 34.2 percent of the total exports, purchases from United States worth $1.195 billion grew by 44.5 percent from $826.98 million a year earlier.
Japan remained at the second spot with a 15.8 percent share. Sales to Japan rose by 34.4 percent to $550.72 million from $409.62 million a year ago.
Singapore bought goods valued at $300.83 million or 8.6 percent of the total exports. Compared to last year, sales to Singapore grew by 30.6 percent from $230.35 million.
Other major markets for December 2000 were Netherlands, $283.45 million; Taiwan, $215.70 million; Hongkong, $130.88 million; Republic of Korea, $105.50 million, United Kingdom of Great Britain, $105.37 million; Germany, $101.60 million; and, Malaysia $77.76 million.
Total earnings from the top ten markets amounted to $3.067 billion or 87.7 percent of the total.
Fig. 4. Philippine Top Exports by Country in December: 2000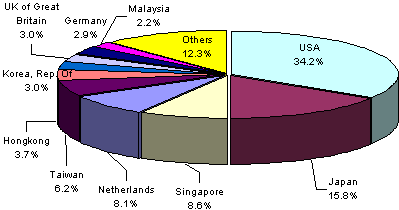
Source: National Statistics Office
Manila, Philippines
| Attachment | Size |
|---|---|
|
|
5.27 KB |
|
|
10.25 KB |
|
|
8.07 KB |