
 .
.
EXPORTED GOODS FOR DECEMBER 2013 UP BY 15.8 PERCENT
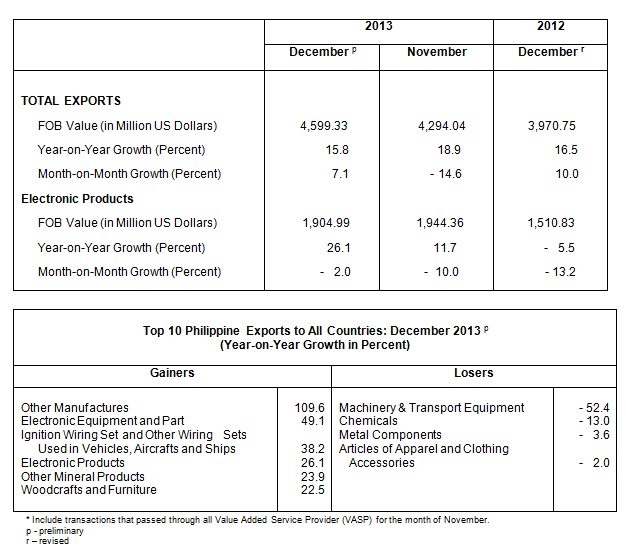
Export earnings in December 2013 amounted to $4.599 billion, a 15.8 percent growth from $3.971 billion recorded value in December of 2012. The positive growth was mainly brought by the increase of six commodities. These are other manufactures, electronic equipment and parts, ignition wiring set and other wiring sets used in vehicles, aircrafts and ships, electronic products, other minerals and woodcrafts and furniture. On a monthly basis, it increased by 7.1 percent from $4.294 billion posted in November 2013. Total merchandise exports for January to December 2013 registered a 3.6 percent increase to $53.978 billion in 2013 from $52.100 billion in same period of 2012.
ELECTRONIC PRODUCTS INCREASE BY 26.1 PERCENT
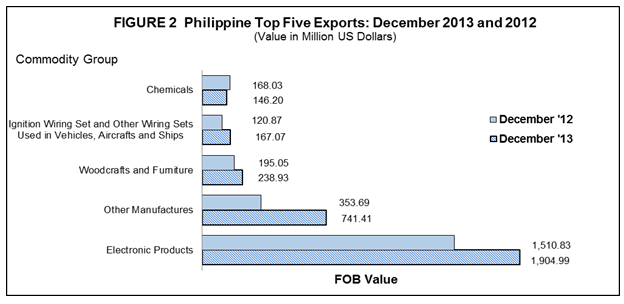
Electronic Products remained as the country’s top export with total receipts of $1.905 billion, accounting for 41.4 percent of the total exports revenue in December 2013. It increased by 26.1 percent from $1.511 billion registered in December 2012. However, on a month-on-month basis, Electronic Products decelerated by 2.0 percent from $1.944 billion posted in November 2013. Components/Devices (Semiconductors), which comprised 27.7 percent of the total exports, shared the biggest among the major groups of electronic products with export earnings worth $1.273 billion and went up by 4.3 percent from $1.220 billion recorded in December 2012.
Other Manufactures was the second top export earner in December 2013 with export revenue of $741.41 million, increasing by 109.6 percent from $353.69 million in December 2012. This was the highest registered year-on-year increase among the top ten exports in December 2013.
Woodcrafts and Furniture recorded as the country’s third top export with revenue valued at $238.93 million or 5.2 percent share to total exports. It increased by 22.5 percent from $195.05 million in same period a year ago.
Ignition Wiring Set and Other Wiring Sets Used in Vehicles, Aircrafts and Ships ranked fourth, with earnings amounting to $167.07 million in December 2013, contributing 3.6 percent share to the total export receipts. This recorded a 38.2 percent increase from the previous year level of $120.87 million.
Chemicals, with 3.2 percent share to the total export receipts, ranked fifth with value posted at $146.20 million. It decreased by 13.0 percent from $168.03 million recorded value during the same month in 2012.
Rounding up the list of the top ten exports for the month of December 2013 were Metal Components with export earnings of $139.93 million, decreasing by 3.6 percent; Machinery and Transport Equipment with export receipts of $122.32 million, down by 52.4 percent; Articles of Apparel and Clothing Accessories with proceeds billed at $119.79 million, decreasing by 2.0 percent; Electronic Equipment and Parts with export receipts of $108.58 million, rising by 49.1 percent; and Other Mineral Products with total receipts of $100.45 million, registering a positive year on year change of 23.9 percent.
Total receipts from the top ten exports reached $3.790 billion, or 82.4 percent of the total exports.
EXPORTS OF MANUFACTURED GOODS STAND AT $3.911 BILLION
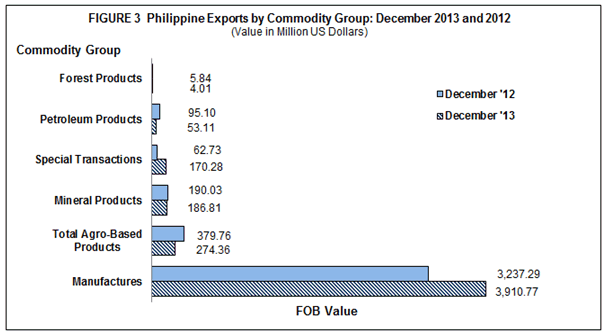
Outward shipments of Manufactured Goods were valued at $3.911 billion, accounting for 85.0 percent of the total export receipts in December 2013. It increased by 20.8 percent from $3.237 billion recorded in December 2012. Similarly, on a monthly basis, it increased by 5.1 percent from $3.720 billion recorded in November 2013.
Receipts from Total Agro-Based Products, with a share of 6.0 percent in December 2013, amounted to $274.36 million. It decreased by 27.8 percent from $379.76 million in December 2012.
Mineral Products recording a 4.1 percent share, decreased by 1.7 percent from $190.03 million in December 2012 to $186.81 million in December 2013.
Merchandise exported from Special Transactions, comprising 3.7 percent share of the total exports revenue in December 2013, rose by 171.5 percent to $170.28 million from $62.73 million in same month a year ago. Similarly, on a month-on-month basis, it increased by 146.3 percent from $69.14 million in November 2013.
Income from Petroleum Products, accounting for 1.2 percent share of the total exports revenue, decreased by 44.2 percent from $95.10 million to $53.11 million reported value in 2013.
Furthermore, Forest Products with 0.1 percent share, decreased by 31.3 percent from $5.84 million in December 2012 to $4.01 million in same month in 2013.
JAPAN ACCOUNTS FOR 23.0 PERCENT TO TOTAL EXPORTS
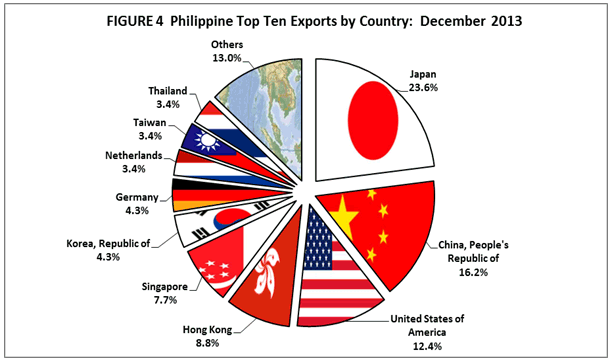
Japan including Okinawa remained as the country’s top destination of exports with revenue amounting to $1.059 billion, comprising 23.0 percent share to total exports for December 2013. It increased by 48.1 percent from $715.29 million recorded value in same month a year ago.
People’s Republic of China with 16.2 percent share to total exports, ranked second with shipments valued at $746.82 million. It rose 79.3 percent from $416.45 million a year ago.
United States of America (USA) including Alaska and Hawaii ranked third, comprising 12.4 percent share to total exports, with export receipts valued at $570.37 million in December 2013. This recorded an increase of 13.6 percent from $502.32 million in same month last year.
Hong Kong placed fourth, representing an 8.8 percent share to total exports, with export earnings worth $405.39 million. It increased by 6.5 percent from $380.62 million posted in December 2012.
Singapore ranked fifth in December 2013 with $353.84 million or 7.7 percent share of the total exports. It accelerated by 4.0 percent from $340.17 million year ago level.
Other top ten market destinations for December 2013 were: Republic of Korea, $199.22 million; Germany, $197.46 million; Netherlands, $157.88 million; Taiwan, $156.35 million; and Thailand, $155.35 million.
Total export receipts from the country’s top ten markets destinations for the month of December 2013 was valued at $4.002 billion or 87.0 percent of the total.
EXPORTS TO EAST ASIA VALUED AT $2.571 BILLION
The country’s merchandise exports to East Asia in December 2013 accounted for 55.9 percent share to total exports, amounting to $2.570 billion or an increase of 32.9 percent from its December 2012 figure of $1.934 billion.
Commodities exported to ASEAN comprised 14.2 percent of the total exports in December 2013 and was valued at $651.67 million. This registered a decrease of 17.0 percent from $785.54 million posted in same month a year ago.
Exports to European Union member-countries, with 10.6 percent share to total merchandise exports, amounted to $487.50 million, a 9.3 percent increase from $446.23 million recorded in December 2012.

Technical Note:
Starting with the February 2007 Press Release, analysis and tables are based on the 2004 Philippine Standard Commodity Classification (PSCC) groupings. This is in compliance with NSCB Resolution No. 03, Series of 2005 entitled “Approving and Adopting the 2004 Philippine Standard Commodity Classification” by all concerned government agencies and instrumentalities.
CARMELITA N. ERICTA
Administrator
| Attachment | Size |
|---|---|
|
|
456.01 KB |
|
|
340.96 KB |
|
|
430.75 KB |
|
|
343.35 KB |
|
|
299.98 KB |
|
|
285.72 KB |