
MERCHANDISE EXPORT PERFORMANCE*
January 2013
(Preliminary)

* Include transactions that passed through Automated Export Documentation System (AEDS).
p - preliminary
r - revised
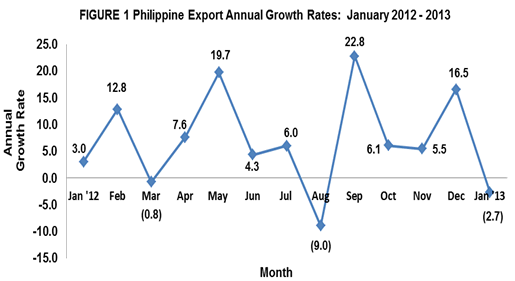
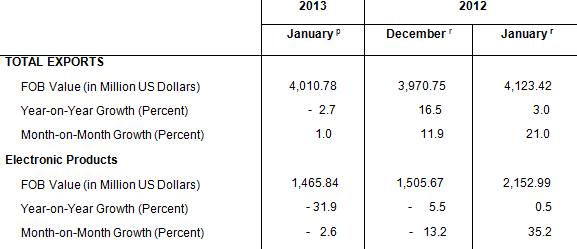
MERCHANDISE EXPORTS FOR JANUARY 2013 DOWN BY 2.7 PERCENT
The Philippine merchandise exports decreased by 2.7 percent from $4.123 billion in January 2012 to $4.011 billion in January 2013. The decrement was supported by the negative growth in articles of apparel and clothing accessories, electronic products, machinery and transport equipment and ignition wiring set and other wiring sets used in vehicles, aircrafts and ships. However, on a monthly basis, receipts from merchandise exports went up by 1.0 percent from $3.971 billion posted in December 2012. Likewise, record showed that volume of outward shipments had a positive year-on-year performance of 100.9 percent compared to same month a year ago.
ELECTRONIC PRODUCTS DROP BY 31.9 PERCENT
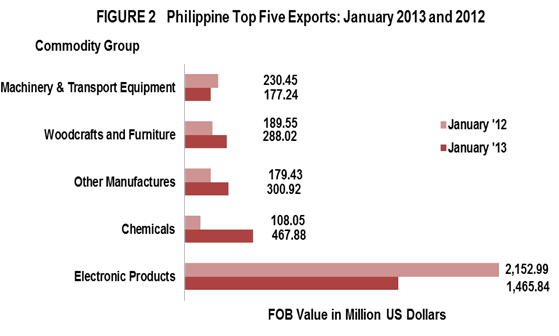
Accounting for 36.6 percent of the total exports revenue in January 2013, Electronic Products emerged as the country’s top export with total receipts of $1.466 billion. It slumped by 31.9 percent from $2.153 billion registered in January 2012. Month-on-month, Electronic Products declined by 2.6 percent from $1.506 billion posted in January 2012. Components/Devices (Semiconductors) which comprised 29.9 percent of the total exports shared the biggest among the major groups of electronic products with export earnings worth $1.197 billion or a decrease of 23.2 percent from $1.560 billion registered in January 2012. Similarly, volume of outward shipments of electronic products and semiconductors also declined by 14.1 percent and 10.3 percent, respectively compared to same period a year ago.
Chemical followed as the second top export earner in January 2013 with total receipts of $467.88 million or a share of 11.7 percent to the total exports revenue. It grew by 333.0 percent from last year’s value of $108.05 million, the highest increase in annual growth from among the top ten exports. However, in terms of volume, this product recorded a dive of 29.5 percent compared to January 2012 recorded volume of outward shipments.
Other manufactures recorded as the country’s third top exporter with revenue valued at $300.92 million (7.5%). It increased by 67.7 percent from $179.43 million recorded during the same month in 2012. Similarly, its volume of shipments registered a positive growth of 67.7 percent.
Ranked fourth in January 2013 and contributing 7.2 percent share to the total export receipts was Woodcrafts and Furniture with earnings amounting to $288.02 million. This figure expanded by 52.0 percent from its year ago level of $189.55 million, Machinery and Transport Equipment with 4.4 percent share to the total export receipts ranked fifth with value posted at $177.24 million or an equivalent 23.1 percent decrement from $230.45 million posted in January 2012.
Rounding up the list of the top ten exports for the month of January 2013 were Metal Components (excluding brakes and servo-brakes), with export revenue of $118.92 million gaining by 56.7 percent; Coconut Oil, including crude and refined, with export earnings of $112.17 million growing by 27.3 percent from $88.11 million export receipt in January 2012; Other Mineral Products with recorded sales amounting to $109.20 million improving by 162.0 percent; Articles of Apparel and Clothing Accessories with proceeds billed at $99.82 million decreasing by 41.7 percent; and Ignition Wiring Set and Other Wiring Sets Used in Vehicles, Aircrafts and Ships consisting only of electrical wiring harness for motor vehicles valued at $98.70 million plunging by 6.1 percent.
Total receipts from the top ten exports reached $3.239 billion, or 80.8 percent of the total exports.
EXPORTS OF MANU
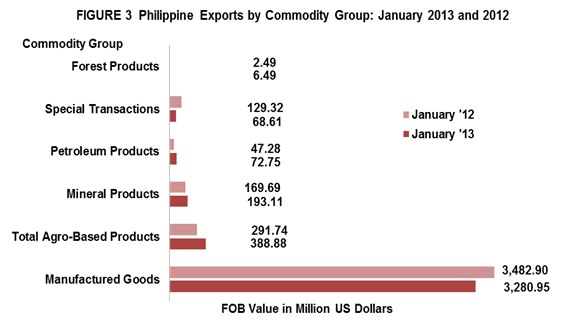
Accounting for 81.8 percent of the total export receipts in January 2013, outward shipments of Manufactured Goods was estimated at $3.281 billion, representing a decrease of 5.8 percent from $3.483 billion recorded in January 2012. Month-on-month, it went up by about 1.5 percent from $3.232 billion recorded in December 2012. Also, outward shipments in terms of gross kilos showed a positive year-on-year change of 14.1 percent compared to shipment in January 2012 and 19.2 percent declined in volume of shipment compared to last month.
Income from Total Agro-Based Products comprising 9.7 percent share of the total exports revenue in January 2013 rose by 33.3 percent to $388.88 million from $291.74 million in January 2012. Similarly, it grew by 2.4 percent from $379.76 million compared to its previous month level. Likewise, volume of shipment was up by 79.2 percent and 3.9 percent, respectively compared to same month a year ago and previous month in 2012. The growth was mainly due to the increase in both value and volume of coconut products.
Earnings from Mineral Products in January 2013 with a share of 4.8 percent reached $193.11 million. It grew by 13.8 percent from $169.69 million in January 2012. Likewise, Petroleum Products accounting for 1.8 percent share of the total exports revenue grew by 53.9 percent to $72.75 million from $47.28 million in January 2012. Both products recorded a positive growth of 227.1 percent and 70.4 percent in terms of their volume of shipments in January 2013.
Export receipts from Special Transactions reflecting 1.7 percent share was lower by 47.0 percent from $129.32 million posted in January 2012 to $68.61 million in January 2012. Similarly, volume of shipments of these products showed also a decrease of 82.2 percent compared to January 2012. Forest Products with 0.2 percent share expanded by 160.3 percent to $6.49 million in January 2013 from $2.49 million in January 2012. Moreover, volume of shipments of this product strengthened by 109.9 percent compared to same period last year.
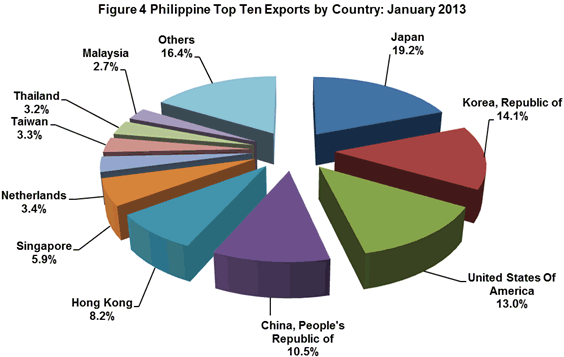
EXPORTS TO JAPAN ACCOUNT FOR 19.2 PERCENT
Japan including Okinawa, comprising 19.2 percent share to total exports for January 2013, emerged as the country’s top destination of exports with revenue amounting to $769.03 million. It was higher by 8.8 percent from $706.79 million recorded a year ago. The export items to Japan consist mainly of wood manufactures, chemical products, electronic products and banana (fresh).
Republic of Korea, with about 14.1 percent share to total exports, followed as the second top market of the country for January 2013 with export earnings worth $564.72 million. This represents an increase of 229.3 percent from $171.51 million reported a year earlier. Chemical products, other manufactures, components/ devises (semiconductors) and sugar are the goods mostly exported to Korea.
United States of America (USA) including Alaska and Hawaii accounting for 13.1 percent share to total exports came in third with shipments amounting to $522.99 million. Compared with its January 2012 level, the amount was lower by 21.0 percent from $662.12 million. Products exported to USA comprised mainly of components/ devises (semiconductors), coconut oil and sugar.
People’s Republic of China ranked fourth in January 2013 with $422.06 million or 10.5 percent share of the total exports. It plummeted by 28.6 percent from its year ago value of $591.23 million.
Fifth in rank and representing 8.2 percent share to total exports was Hong Kong with export earnings worth $327.43 million, a decrease of 8.9 percent from $359.37 million posted in January 2012.
Other top ten markets for January 2013 were Singapore, $237.00 million; Netherlands, $136.62 million; Taiwan, $134.11 million; Thailand, $129.15 million; and Malaysia, $109.21 million.
Total export receipts from the country’s top ten markets for the month of January 2013 amounted to $3.352 billion or 83.6 percent of the total.
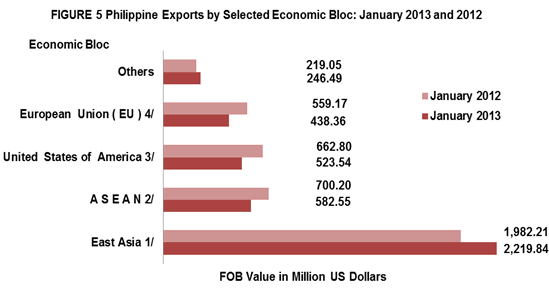
EXPORTS TO EAST
The Philippines’ merchandise exports to East Asia in January 2013 contributed 55.4 percent share to total exports, amounting to $2.220 billion or an increase of 12.0 percent from its January 2012 figure of $1.982 billion.
Exports to ASEAN member-countries accounting for 14.5 percent share to total merchandise exports in January 2013 reached $582.55 million, a negative 16.8 percent annual growth from $700.20 million recorded in January 2012.
Merchandise exports to European Union (EU), on the other hand, sharing 10.9 percent to total merchandise exports in January 2013 was valued at $438.36 million. It fell by 21.6 percent from $559.17 million posted in January 2012.
Notes:
1/ - includes China, Hong Kong, Japan, Macau, Mongolia, N, Korea, S. Korea, Taiwan
2/ - includes Brunei Darussalam, Cambodia, Indonesia, Laos, Malaysia, Myanmar, Singapore, Thailand, Vietnam
3/ - includes Alaska and Hawaii
4/ - includes Austria, Belgium, Bulgaria, Cyprus, Czech Republic, Denmark, Estonia, Finland, France, Germany, Greece,
Hungary, Ireland, Italy, Latvia, Lithuania, Luxembourg, Malta, Netherlands, Poland, Portugal, Romania, Slovakia,
Slovenia, Spain, Sweden and UK Great Britain
Technical Note:
Starting with the February 2007 Press Release, analysis and tables are based on the 2004 Philippine Standard Commodity Classification (PSCC) groupings. This is in compliance with NSCB Resolution No. 03, Series of 2005 entitled “Approving and Adopting the 2004 Philippine Standard Commodity Classification” by all concerned government agencies and instrumentalities.
CARMELITA N. ERICTA
Administrator
Source: Foreign Trade Statistics Section
Industry and Trade Statistics Department
National Statistics Office
Manila, Philippines
| Attachment | Size |
|---|---|
|
|
13.92 KB |
|
|
28.5 KB |
|
|
6.72 KB |
|
|
6.81 KB |