
MERCHANDISE EXPORT PERFORMANCE*
July 2013
(Preliminary)

a/ no value in July 2012
* Include transactions that passed through all Value Added Service Provider (VASP) for the month of July.
p - preliminary
r – revised
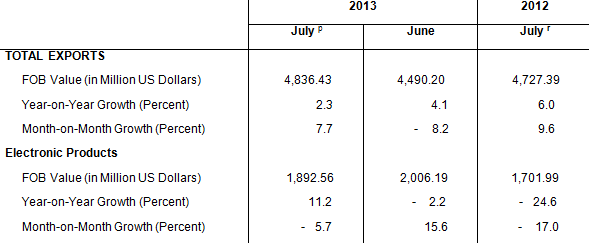
MERCHANDISE EXPORTS FOR JULY 2013 UP BY 2.3 PERCENT
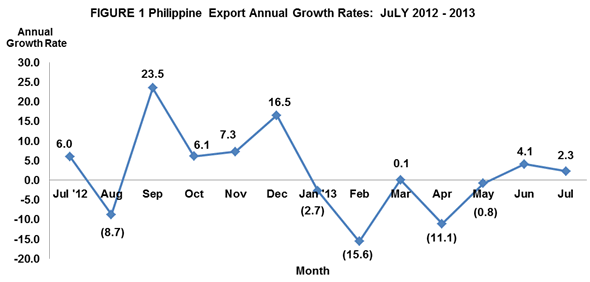
Export earnings in July 2013 amounted to $4.836 billion, a 2.3 percent increment from $4.727 billion recorded in July of 2012. Similarly, on a monthly basis, it grew by 7.7 percent from $4.490 billion posted in June 2013. The positive growth was supported by five major commodities out of the top ten commodities for the month. These are machinery and transport equipment, woodcrafts and furniture, chemicals, electronic products and cathodes & sections of cathodes of refine copper. Aggregate merchandise exports for January to July 2013 showed a decrease of 3.4 percent from $31.487 billion in 2012 to $30.422 billion in 2013.
ELECTRONIC PRODUCTS INCREASE BY 11.2 PERCENT
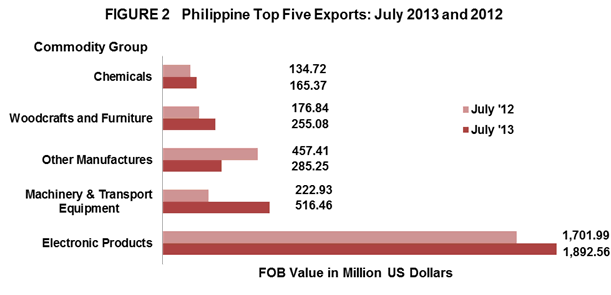
Accounting for 39.1 percent of the total exports revenue in July 2013, Electronic Products emerged as the country’s top export with total receipts of $1.893 billion. It went up by 11.2 percent from $1.702 billion registered in July 2012. On the other hand, month-on-month, Electronic Products was down by 5.7 percent from $2.006 billion posted in June 2013. Components/Devices (Semiconductors), which comprised 26.1 percent of the total exports, shared the biggest among the major groups of electronic products with export earnings worth $1.261 billion or a decline of 6.2 percent from $1.344 billion registered in July 2012.
Machinery and Transport Equipment as the second top export earner in July 2013 with export revenue of $516.46 million, was up 131.7 percent, the highest growth among the top ten products.
Other Manufactures recorded as the country’s third top export with revenue valued at $285.25 million or 5.9 percent share to total exports. It decreased by 37.6 percent compared to $457.41 million in same period a year ago.
Ranked fourth in July 2013 and contributing 5.3 percent share to the total export receipts was Woodcrafts and Furniture with earnings amounting to $255.08 million. Compared to its a year ago level of $176.84 million, this recorded a 44.2 percent year-on-year change.
Chemicals, with 3.4 percent share to the total export receipts, ranked fifth with value posted at $165.37 million. It rose by 22.8 percent from $134.72 million recorded value during the same month in 2012.
Rounding up the list of the top ten exports for the month of July 2013 were Other Mineral Products with export earnings of $156.90 million, down by 21.3 percent; Cathodes & Sections of Cathodes, of Refined Copper with export receipts of $140.59 million and do not have export value for the period of May to august in 2012; Articles of Apparel and Clothing Accessories with proceeds billed at $122.81 million falling by 19.5 percent; Ignition Wiring Set and Other Wiring Sets Used in Vehicles, Aircrafts and Ships consists only of electrical wiring harness for motor vehicles export recoded $114.05 million, losing by 16.6 percent and Coconut Oil with total receipts of $113.87 million slightly declining by 0.9 percent compare to same period a year ago.
Total receipts from the top ten exports reached $3.763 billion, or 77.8 percent of the total exports.
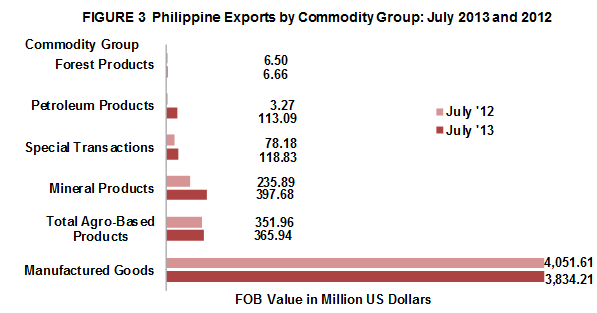
EXPORTS OF MANUFACT URED GOODS STAND AT $3.834 BILLION
Accounting for 79.3 percent of the total export receipts in July 2013, outward shipments of Manufactured Goods was estimated at $3.834 billion, representing a decrease of 5.4 percent from $4.052 billion recorded in July 2012. Furthermore, on a monthly basis, it went up by 3.2 percent from $3.716 billion recorded in June 2013.
Income from Total Agro-Based Products, comprising 7.6 percent share of the total exports revenue in July 2013, went up by 4.0 percent to $365.94 million from $351.96 million. Compared to its previous month level, it also grew by 13.5 percent from $322.46 million in June 2013.
Earnings from Mineral Products, with a share of 8.2 percent in July 2013, reached $397.68 million. It inflated by 68.6 percent from $235.89 million in July 2012.
Special Transactions reflecting a 2.5 percent share, increased by 52.0 percent to $118.83 million in July 2013 from $78.18 million in July 2012. Moreover, export receipts from Petroleum Products accounting for 2.3 percent share of the total exports revenue expanded by more than three thousand percent to $113.09 million from $3.27 million reported value a year ago.
Forest Products with 0.1 percent share rose by 2.4 percent from $6.50 million in July 2012 to $6.66 million in July 2013.
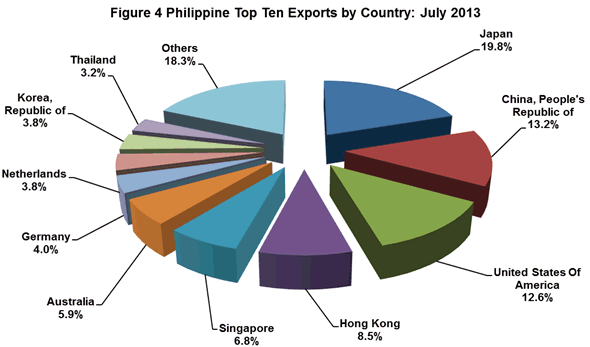
EXPORT TO JAPAN ACCOUNTS FOR 19.8 PERCENT
Japan including Okinawa comprising 19.8 percent share to total exports for July 2013, emerged as the country’s top destination of exports with revenue amounting to $956.44 million. It was higher by 24.2 percent from $770.08 million recorded a year ago.
People’s Republic of China, with 13.2 percent share to total exports, came in second with shipments amounting to $640.40 million. Compared to same month a year ago, this value expanded by 27.7 percent from $501.34 million.
United States of America (USA) including Alaska and Hawaii, accounting for 12.6 percent share to total exports followed as the third top market of the country for July 2013 with export earnings worth $610.84 million. This represents a decrease of 8.7 percent from $668.69 million reported a year earlier.
Fourth in rank and representing 8.5 percent share to total exports was Hong Kong with export earnings worth $411.33 million or an increase of 12.5 percent from $365.54 million posted in July 2012.
Singapore ranked fifth in July 2013 with $327.78 million or 6.8 percent share of the total exports decreasing by 60.7 percent from its year ago amount of $834.01 million.
Other top ten markets for July 2013 were, Australia $286.73 million; Germany, $191.91 million; Netherlands, $185.86 million; Republic of Korea, $181.68 million; and Thailand, $156.14 million.
Total export receipts from the country’s top ten markets for the month of July 2013 amounted to $3.949 billion or 81.7 percent of the total.
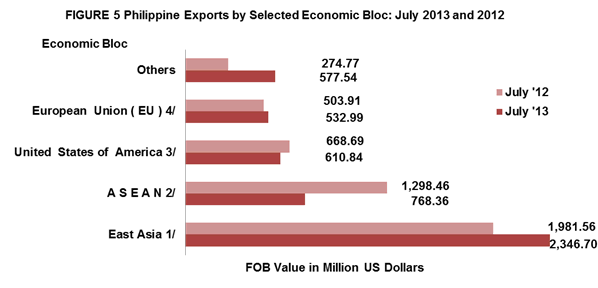
EXPORTS TO EAST ASIA WORTH $2.347 BILLION
The merchandise exports of the Philippines to East Asia in July 2013 accounted 48.5 percent share to total exports, amounting to $2.347 billion or an increase of 18.4 percent from its July 2012 figure of $1.987 billion.
Exports to ASEAN member-countries, accounting for 15.9 percent share to total merchandise exports in July 2013, reached $768.36 million, a 40.8 percent decrease from $1.298 billion recorded in July 2012.
Merchandise exports to European Union (EU), on the other hand, sharing 11.0 percent to total merchandise exports in July 2013, was valued at $532.99 million. It expanded by 5.8 percent from $503.91 million posted in July 2012.
Notes:
1/ - includes China, Hong Kong, Japan, Macau, Mongolia, N, Korea, S. Korea, Taiwan
2/ - includes Brunei Darussalam, Cambodia, Indonesia, Laos, Malaysia, Myanmar, Singapore, Thailand, Vietnam
3/ - includes Alaska and Hawaii
4/ - includes Austria, Belgium, Bulgaria, Cyprus, Czech Republic, Denmark, Estonia, Finland, France, Germany, Greece,
Hungary, Ireland, Italy, Latvia, Lithuania, Luxembourg, Malta, Netherlands, Poland, Portugal, Romania, Slovakia,
Slovenia, Spain, Sweden and UK Great Britain
Technical Note:
Starting with the February 2007 Press Release, analysis and tables are based on the 2004 Philippine Standard Commodity Classification (PSCC) groupings. This is in compliance with NSCB Resolution No. 03, Series of 2005 entitled “Approving and Adopting the 2004 Philippine Standard Commodity Classification” by all concerned government agencies and instrumentalities.
CARMELITA N. ERICTA
Administrator
Source: Foreign Trade Statistics Section
Industry and Trade Statistics Department
National Statistics Office
Manila, Philippines