
MERCHANDISE EXPORTS POST 4.0 PERCENT DECREASE
Receipts from merchandise exports for January to March 2001 decreased by 0.5 percent to $ 8.562 billion from $ 8.607 billion a year ago.
Aggregate receipt for March 2001 from merchandise exports declined by 4.0 percent to $2.868 billion from $2.989 billion a year ago.
ELECTRONIC COMPONENTS REGISTER 11.2 PERCENT DECREASE
Receipts from Electronic Components, accounting for 55.8 percent of the aggregate revenue for March 2001 went down by 11.2 percent to $1.600 billion from $1.802 billion a year earlier.
Articles of Apparel and Clothing Accessories remained as the second top earner with a combined share of 6.85 percent and an aggregate receipt of $196.50 million or 3.0 percent higher than $190.73 million in 2000.
The third top earner consisted of Ignition Wiring Set and Other Wiring Sets Used in Vehicles, Aircrafts and Ships that was valued at $46.04 million, or a 10.2 percent decrease from $51.26 million in 2000.
Metal Components ranked fourth with sales amounting to $45.21 million for an increase of 35.2 percent from $33.43 million last year.
Revenue from Other Products Manufactured from Materials Imported on Consignment Basis grew by 58.4 percent to $37.3 million from $23.54 million in March 2000.
Woodcrafts and Furniture, with a 1.2 percent share, reported sales of $34.41 million that was 22.1 percent lower than $44.18 million last year.
Rounding up the list of the top exports for March 2001 wereBananas (Fresh), $25.22 million; Coconut Oil, $22.13 million;Petroleum Products, $22.75 million; and, Cathodes & Sections of Cathodes, of Refined Copper, $18.51 million.
Aggregate receipt for the top ten exports amounted to $2.049 billion, or 71.4 percent of the total.
Fig. 1. Philippine Top Exports in March : 2000 & 2001
( F.O.B. Value in Million US Dollar )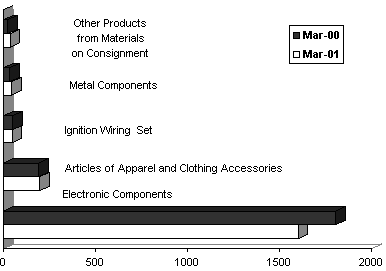
MANUFACTURED GOODS POST 4.9 PERCENT DECREASE
Accounting for 89.5 percent of total receipts, exports ofManufactured Goods posted a 4.9 percent decrease as sales reached $2.568 billion, down from $2.7 billion a year earlier.
Income from Agro-Based and Other Agro-Based Productscombined for $135.05 million or 4.7 percent of the total. Aggregate revenue for these commodity groups grew by 15.1 percent from $117.34 million last year.
Exports of Petroleum Products went down by 47.6 percent to $22.76 million while Special Transactions increased by 31.5 percent to $94.31 million.
Fig. 2. Philippine Exports by Commodity Group in March : 2000 & 2001
( F.O.B. Value in Million US Dollar ) 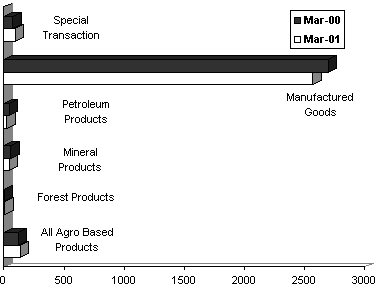
EXPORTS TO US ACCOUNT FOR 26.5 PERCENT
Accounting for 26.5 percent of aggregate receipts for March 2001, value of exports to the United States placed at $761.26 million declined by 13.3 percent from $877.60 million last year.
Japan followed with a 17.0 percent share. Valued at $488.04 million, exports to Japan rose by 12.2 percent from $435.09 million in 2000.
Exports to Netherlands, which was the third biggest market accounting for 8.6 percent of the total, decreased by 2.4 percent in sales amounting to $245.73 million from $251.65 million a year earlier.
Singapore emerged as the fourth biggest market as shipments of local goods amounted to $231.68 million or 8.1 percent of the total. Receipts increased by 7.0 percent from $216.60 million last year.
Other top markets for March 2001 were Thailand, $167.91 million; Taiwan, $152.45 million; Germany, $134.76 million;Hongkong, $133.47 million; United Kingdom of Great Britain, $101.06 million; and Malaysia, $69.86 million.
Total export receipts from the top ten markets amounted to $2.486 billion or 86.7 percent of the total.
Fig. 3. Philippine Top Exports by Country in March 2001
( F.O.B. Value in Million US Dollar ) 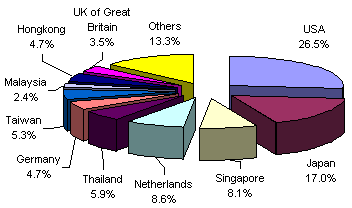
Source: National Statistics Office
Manila, Philippines
| Attachment | Size |
|---|---|
|
|
10.07 KB |
|
|
5.39 KB |
|
|
8.04 KB |