
MERCHANDISE EXPORT PERFORMANCE*
October 2012
(Preliminary)

* Include transactions that passed through Automated Export Documentation System (AEDS) and Electronic to Mobile (E2M).
p - preliminary
r - revised
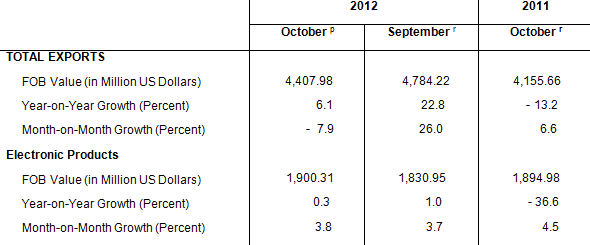
MERCHANDISE EXPORTS INCREASE BY 6.1 PERCENT FOR OCTOBER
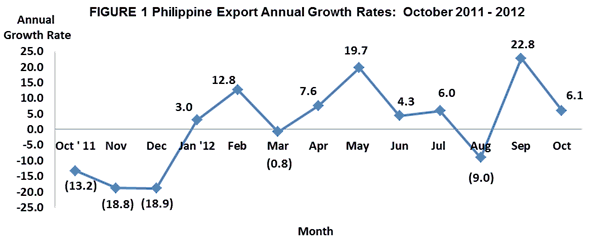
Export earnings in October 2012 expanded by 6.1 percent to $4.408 billion from $4.156 billion recorded in October 2011. The growth was brought about by the increase in value of shipments of commodities such as Tuna (includes fresh, frozen, prepared or preserved in airtight containers), Bananas (fresh), Cathodes & Sections of Cathodes, of Refined Copper, Petroleum Products (includes refined petroleum products, manufactures from crude petroleum oil imported on consignment basis), Metal Components (excluding brakes & servo-brakes), Woodcrafts and Furniture, Coconut Oil (includes crude and refined) and Electronic Products. However, on a monthly basis, it contracted by 7.9 percent from $4.784 billion posted in September 2012. Meanwhile, total volume of outward shipments in October 2012 showed an increase of 39.2 percent year-on-year and 23.5 percent expansion compared to last month’s outward shipments. Likewise, cumulative merchandise exports for the first ten months of 2012 recorded a positive growth of 7.1 percent to $44.475 billion from $41.532 billion posted during the same period of 2011.
ELECTRONIC PRODUCTS GROW BY 0.3 PERCENT
Electronic Products emerged as the country’s top export with total receipts of $1.900 billion. It accounted for 43.1 percent of the total exports revenue and slightly grew by 0.3 percent in October 2012. On the other hand, outward shipments were down by 2.1 percent compared to same month last year’s recorded shipments. Components/Devices (Semiconductors), which comprised 35.5 percent of the total exports, had the biggest share among the major groups of electronic products with export earnings worth $1.564 billion and registered an increase of 7.5 percent from $1.455 billion in October 2011. On a monthly basis, electronic products as well as semiconductors showed a positive growth of 3.8 percent and 6.5 percent, respectively. Meanwhile, volume of outward shipments of semiconductors slightly inched up by 0.5 percent compared to same period a year ago.
Woodcrafts and Furniture with 5.4 percent share in the total value of exports for October 2012 was recorded as the country’s second top export with revenue valued at $237.25 million. This figure exhibited a growth of 14.3 percent compared with its year ago level of $207.64 million. Likewise, volume of this product also grew by 35.5 percent compared to the same period last year.
Cathodes & Sections of Cathodes, of Refined Copper followed as the third top export earner in October 2012 with total receipts of $149.63 million or a share of 3.4 percent to total exports revenue. It expanded by 44.8 percent compared with its year ago level of $103.37 million. Outward shipment of this product also showed an expansion of 55.5 percent compared to its year ago recorded shipment.
Ranked fourth in October 2012 and contributing 2.8 percent share to the total export receipts were Ignition Wiring Set and Other Wiring Sets Used in Vehicles, Aircrafts and Ships consisting only of electrical wiring harness for motor vehicles with earnings amounting to $124.85 million. It slightly went down by 0.4 percent from $125.41 million registered in October 2011. Furthermore, volume of shipments of this commodity showed a 13.3 percent increase compared to last year same month period.
Metal Components (excluding brakes & servo-brakes) with 2.7 percent share to the total export receipts ranked fifth with value posted at $117.59 million. It increased by 40.7 percent from $83.56 million recorded in October 2011. On the other hand, volume of outward shipments decreased by almost 8.0 percent compared to it’s a year ago volume of shipment.
Rounding up the list of the top ten exports for the month of October 2012 were Coconut Oil including crude and refined with export revenue of $102.02 million increasing by 5.6 percent; Bananas (fresh) with export receipts of $96.34 million, gaining by 101.9 percent; Articles of Apparel and Clothing Accessories with export earnings of $87.59 million losing by 49.4 percent; Petroleum Products (includes refined petroleum products, manufactures from crude petroleum oil imported on consignment basis) with recorded sales of $82.43 million increasing by 43.5 percent; and Tuna (includes fresh, frozen, prepared or preserved in airtight containers) with proceeds billed at $63.91 million. It rose by 294.4 percent, the highest annual increase among the top ten exports, compared to same month a year ago level of about $16.2 million.
Total receipts from the top ten exports reached $2.962 billion, or 67.2 percent of the total exports.

EXPORTS OF MANU
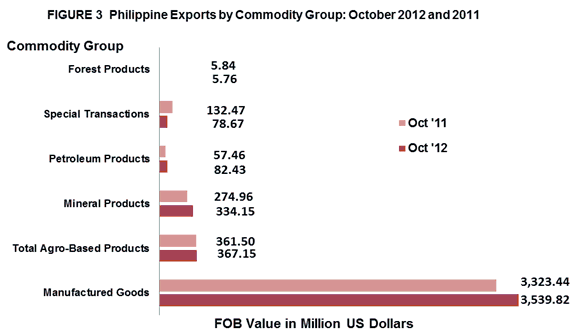
Accounting for about 80.3 percent of the total export receipts in October 2012, value of outward shipments of Manufactured Goods was estimated at $3.540 billion, representing an increase of 6.5 percent from $3.323 billion recorded in October 2011. Outward shipments in terms of gross kilos showed a positive year on year change of 65.8 percent compared to shipment in October 2011. However, value went down by 13.9 percent compared to recorded value of $4.112 billion in September 2012 and volume grew by 42.0 percent month-on-month.
Income from Total Agro-Based Products, comprising 8.3 percent share of the total exports revenue in October 2012, went up by 1.6 percent to $367.15 million from $361.50 million. Similarly, it expanded by 17.6 percent from $312.23 million in September 2012. Also, this product showed an expansion in terms of volume with 55.2 percent year-on-year change and 18.5 percent month-on-month change. The upward trend was mainly due to the increase in both the value and volume of export items like coconut products and fruits and vegetables.
Earnings from Mineral Products with a share of 7.6 percent reached $334.15 million. It went up by 21.5 percent from $274.96 million in October 2011. Moreover, export receipts from Petroleum Products, registered at $82.43 million and with a 1.9 percent share of the total export earnings, grew by 43.5 percent compared to same month a year ago.
Export value of Special Transactions which consist of commodities like gifts, donations, machinery and equipment returned to the country, replacement of returned goods and the likes reflecting 1.8 percent share was lower by 40.6 percent from $132.47 million in October 2011 to $78.67 million in October 2012. Similarly, shipment of products categorized under special transactions showed a decrease of 43.9 percent compared to October 2011 recorded volume of outward shipments. Forest Products accounting for 0.1 percent share of the total exports revenue decreased by 1.3 percent from $5.84 million a year ago to $5.76 million value in October 2012. Moreover, volume of shipments of this product weakens by 43.9 percent compared to same period last year.
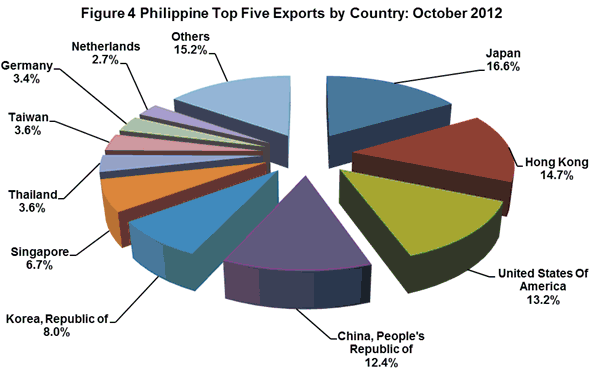
EXPORTS TO JAPAN ACCOUNTS FOR 16.6 PERCENT
Japan including Okinawa getting 16.6 percent share of the total exports for October 2012 emerged as the country’s top destination of exports with revenue amounting to $730.71 million. It was lower by 12.9 percent compared with $838.74 million recorded a year ago. The export items to Japan consist mainly of woodcrafts furniture, bananas (fresh) and components/devices (semiconductors).
Hong Kong with 14.7 percent share to total exports followed as the second top market of the country for October 2012 with export earnings worth $646.93 million. This represented an increase of 135.8 percent from $274.42 million reported a year earlier. Electronic products particularly components/devices (semiconductors) and petroleum products are the goods mostly exported to Hong Kong.
United States of America (USA) including Alaska and Hawaii accounting for 13.2 percent share to total exports came in third with shipments amounting to $583.56 million. Compared to the same month a year ago, however, its value contracted by 4.0 percent from $607.94 million. Products exported to USA comprised mostly of electronic products, coconut oil and tuna.
People’s Republic of China ranked fourth in October 2012 with $548.43 million or 12.4 percent share of the total exports. The amount was lower by 11.2 percent from last year’s amount of $617.47 million.
Fifth in rank and representing almost 8.0 percent share to total exports was Republic of Korea with export earnings worth $352.19 million which recorded a growth of 82.7 percent from $192.80 million posted in October 2011.
Other top ten markets for October 2012 were Singapore, $293.24 million; Thailand, $158.80 million; Taiwan, $157.82 million; Germany, $147.73 million; and Netherlands, $120.56 million.
Total export receipts from the country’s top ten markets for the month of October 2012 amounted to $3.740 billion or 84.9 percent of the total.
EXPORTS TO EAST
The merchandise exports of the Philippines to East Asia (China, Hong Kong, Japan, Macau, Mongolia, North Korea, South Korea and Taiwan) in October 2012 accounted for 55.3 percent share of total exports, amounting to $2.439 billion or an increase of 17.2 percent from its October 2011 figure of $2.081 billion.
Exports to ASEAN member-countries, accounting for 14.6 percent share to total merchandise exports in October 2012 reached $643.47 million and declined by 1.1 percent from $650.66 million recorded in October 2011.
Merchandise exports to European Union (EU), sharing 9.8 percent to total merchandise exports in October 2012, was valued at $432.11 million. It dropped by 14.2 percent from $503.60 million posted in October 2011.

Notes:
1/ - includes China, Hong Kong, Japan, Macau, Mongolia, N, Korea, S. Korea, Taiwan
2/ - includes Brunei Darussalam, Cambodia, Indonesia, Laos, Malaysia, Myanmar, Singapore, Thailand, Vietnam
3/ - includes Alaska and Hawaii
4/ - includes Austria, Belgium, Bulgaria, Cyprus, Czech Republic, Denmark, Estonia, Finland, France, Germany, Greece,
Hungary, Ireland, Italy, Latvia, Lithuania, Luxembourg, Malta, Netherlands, Poland, Portugal, Romania, Slovakia,
Slovenia, Spain, Sweden and UK Great Britain
Technical Note:
Starting with the February 2007 Press Release, analysis and tables are based on the 2004 Philippine Standard Commodity Classification (PSCC) groupings. This is in compliance with NSCB Resolution No. 03, Series of 2005 entitled “Approving and Adopting the 2004 Philippine Standard Commodity Classification” by all concerned government agencies and instrumentalities.
CARMELITA N. ERICTA
Administrator
Source: Foreign Trade Statistics Section
Industry and Trade Statistics Department
National Statistics Office
Manila, Philippines