
Release Date :
RICE
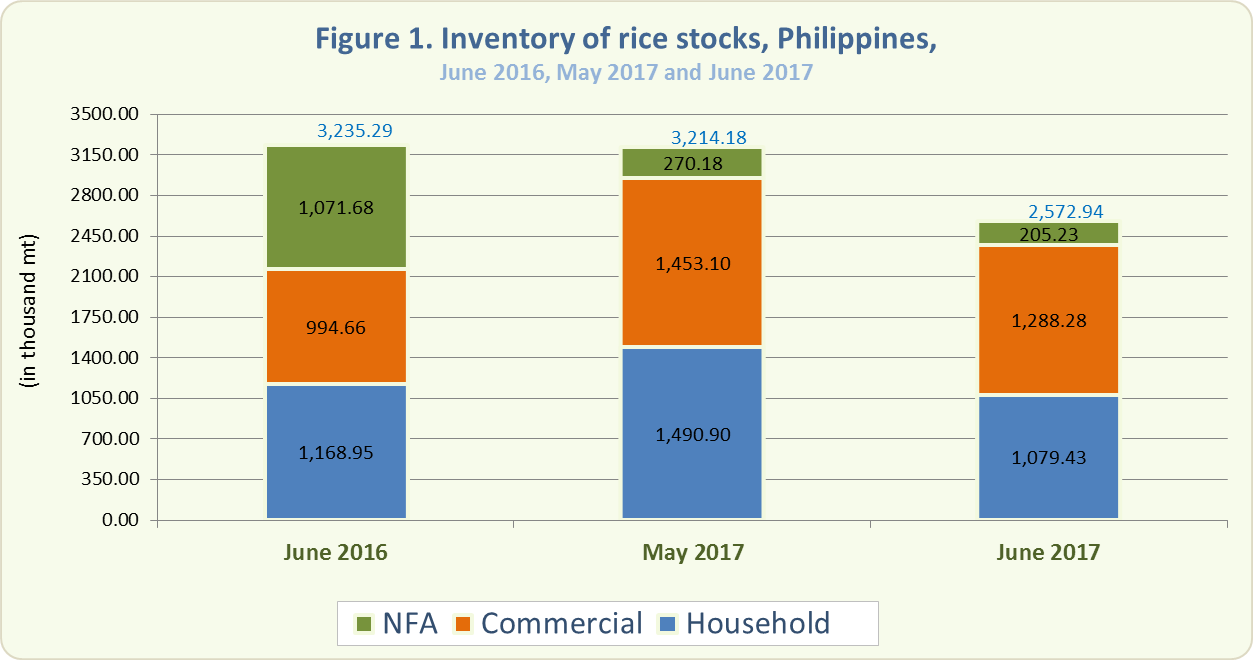
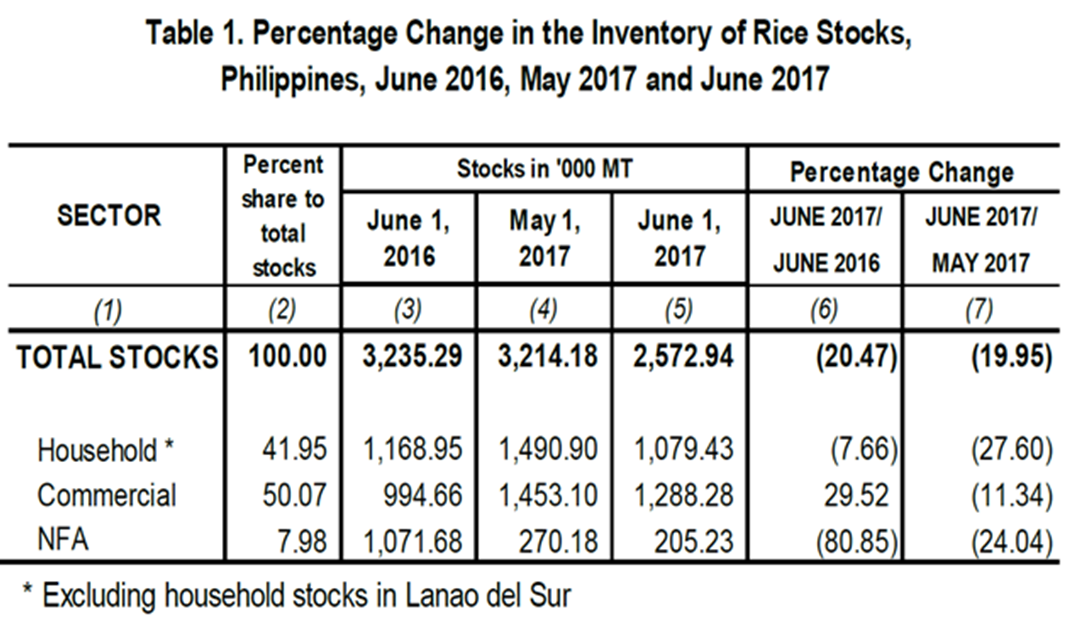
- The total rice stock inventory as of June 1, 2017 was 2,572.94 thousand metric tons (Figure 1). This was 20.47 percent below the 3,235.29 thousand metric tons level in June 2016 and 19.95 percent lower than the previous month’s inventory level of 3,214.18 thousand metric tons (Table 1).
- Compared with the previous year, rice stocks in the households and in NFA depositories dropped by 7.66 percent and 80.85 percent, respectively. However, stocks in commercial warehouses grew by 29.52 percent (Table 1).
- Compared with the previous month, stocks in the households, in commercial warehouses and in NFA depositories declined by 27.60 percent, 11.34 percent and 24.04 percent, respectively (Table 1).
- Of this month’s total rice stock inventory, 41.95 percent were with the households, 50.07 percent were in commercial warehouses, and 7.98 percent were in NFA depositories. The latter comprised 70.99 percent of imported rice.
- The total rice inventory for this month would be sufficient for 76 days. Stocks in the households would be enough for 32 days, those in commercial warehouses for 38 days, and those in NFA depositories for 6 days.
CORN
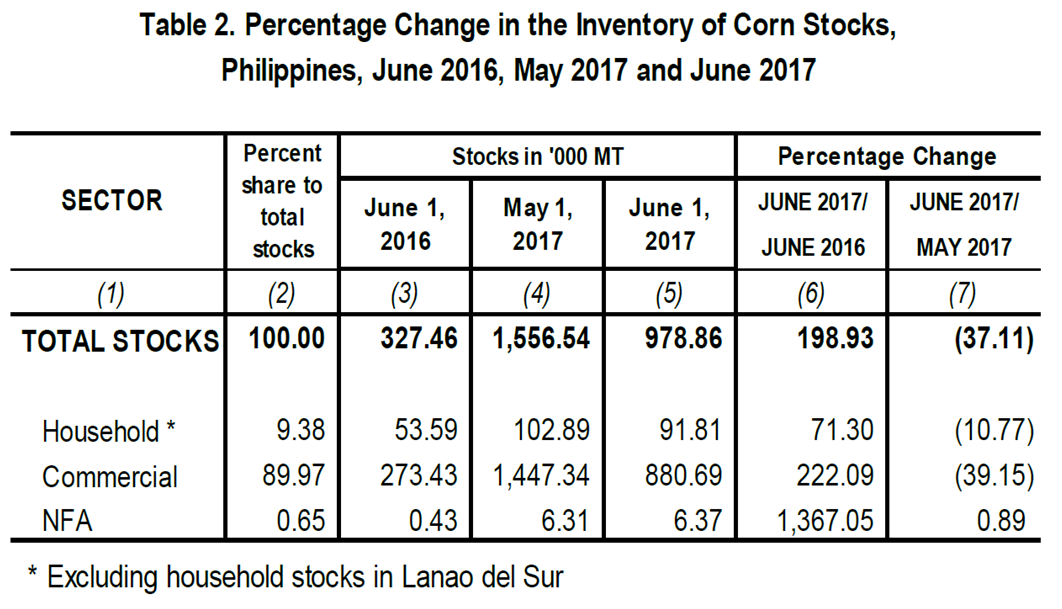
- As of June 1, 2017, the total corn stock inventory was 978.86 thousand metric tons (Figure 2). This was 198.93 percent higher than the previous year’s record of 327.46 thousand metric tons but 37.11 percent below the previous month’s level of 1,556.54 thousand metric tons (Table 2).
- Corn stocks in all sectors increased compared with their levels the previous year. Stocks in the households grew by 71.30 percent, in commercial warehouses by 222.09 percent, and in NFA depositories by 1,367.05 percent (Table 2).
- Month-on-month, corn stocks in the households and in commercial warehouses decreased by 10.77 percent and 39.15 percent, respectively. However, stocks in NFA depositories increased by 0.89 percent (Table 2).
- Around 89.97 percent of this month’s total corn stock inventory were in commercial warehouses, 9.38 percent were with the households, and 0.65 percent in NFA depositories.

Technical Notes
Monthly rice and corn stocks inventory are generated from three sectors, namely: household, commercial, and National Food Authority (NFA). The household stocks are taken from the Palay and Corn Stocks Survey (PCSS1) of the PSA, which covers farming and non-farming households nationwide. The commercial stocks are sourced from registered grains businessmen through the Commercial Stocks Survey (CSS), conducted by the NFA, the results of which are submitted to PSA. NFA stocks are monitored from their warehouses/depositories.
| Attachment | Size |
|---|---|
|
|
679.37 KB |