
Release Date :
RICE
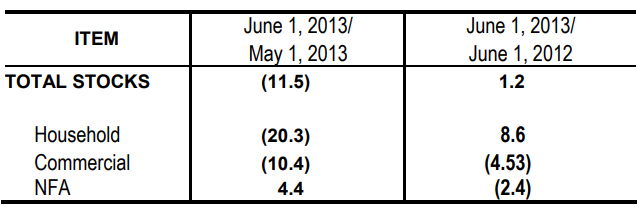
- The June 1, 2013 total rice stock inventory was estimated at 2.31 million metric tons (Figure 1). It was 11.5 percent lower than last month’s record of 2.61 million metric tons but 1.2 percent higher than last year’s level of 2.29 million metric tons. (Table 1).
- Relative to last month’s inventory levels, rice stock in the households decreased by 20.3 percent and those in commercial warehouses by 10.4 percent. On the other hand, stocks in NFA depositories where 23 percent were imported rice, grew by 4.4 percent.
- Compared to last year’s records, stocks in commercial warehouses dropped by 4.53 percent and those in NFA depositories by 2.4 percent. In contrast, stocks in the households increased by 8.6 percent
- The June 1, 2013 total rice stocks would be enough for 68 days. Household stocks would last for 28 days. Stocks in commercial warehouses would be good for 21 days while those in NFA depositories would last for 19 days.
- Of this month’s total rice stocks, households accounted for 41 percent, commercial warehouses had 31 percent while NFA shared 28 percent.
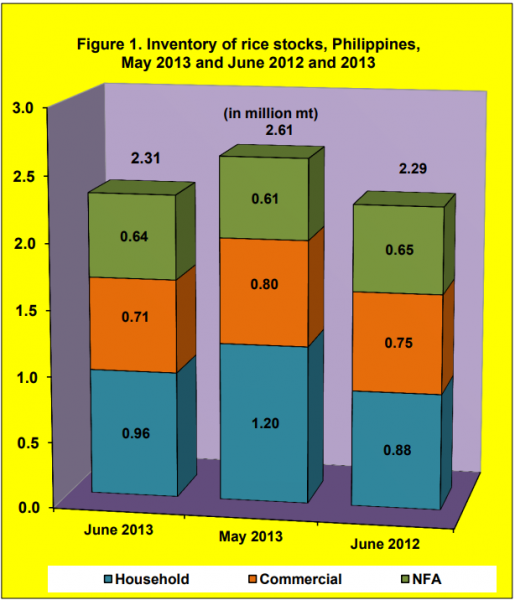
Table 1. Percentage change in the inventory of rice stocks,
Philippines, May 2013 and June 2012 and 2013
CORN
- The June 1, 2013 total corn stock inventory was 139.5 thousand metric tons (Figure 2). This was 39.6 percent lower than last month’s record of 230.8 thousand metric tons and 23.5 percent below last year’s level of 182.4 thousand metric tons (Table 2).
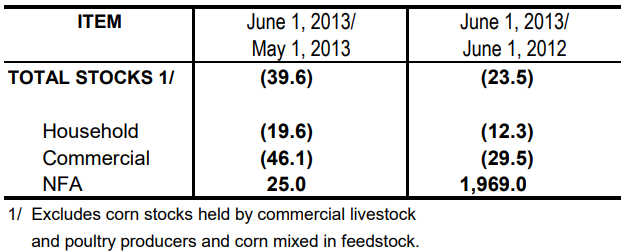
- Compared with the previous month’s levels, stocks in the households decreased by 19.6 percent and those in commercial warehouses by 46.1 percent. However, stocks in NFA depositories went up by 25.0 percent.
- Compared with the inventory records of June 2012, this month’s holdings dropped by 12.3 percent in the households and 29.5 percent in commercial warehouses. However, stocks in NFA depositories grew from 0.15 thousand metric ton to 3.0 thousand metric tons.
- Of the current stock level, about 29.0 percent were with the households and 69.0 percent were with the commercial warehouses. NFA depositories accounted for about 2.0 percent.
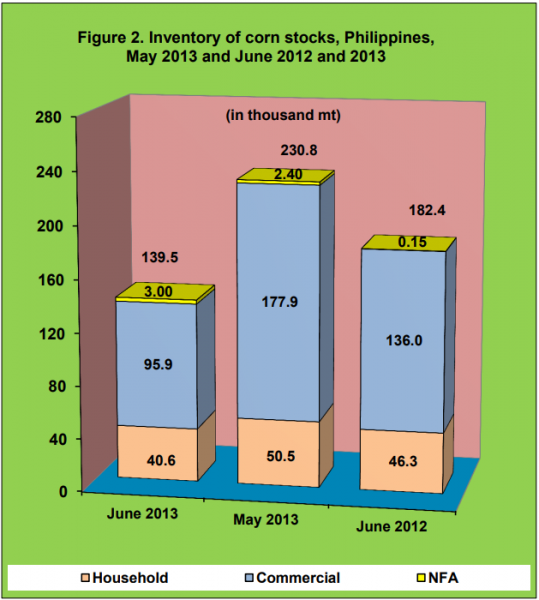
Table 2. Percentage change in the inventory of corn stocks,
Philippines, May 2013 and June 2012 and 2013
| Attachment | Size |
|---|---|
|
|
361.06 KB |