
Release Date :
RICE
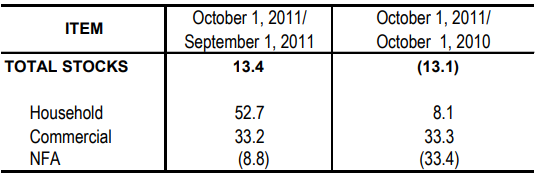
- The total rice stock inventory as of October 1, 2011 was 2.74 million metric tons (Figure 1). The volume of stocks was higher by 13.4 percent from last month’s level of 2.41 million metric tons, but 13.1 percent lower than the previous year’s inventory of 3.15 million metric tons (Table 1).
- Relative to last month’s inventory levels, household stocks went up by 52.7 percent, while those in commercial warehouses grew by 33.2 percent. In contrast, stocks in NFA depositories of which 66 percent were imported rice, declined by 8.8 percent.
- Against last year’s records, stocks in the households were higher by 8.1 percent and those in commercial warehouses by 33.3 percent. However, stocks in NFA depositories decreased by 33.4 percent.
- The total volume of rice stocks as of October 1, 2011 would be good for 80 days. Stocks in NFA depositories would be good for 37 days, while those in commercial warehouses would last for 19 days. Household stocks would be enough for 24 days.
- Of this month’s total rice stocks, 30 percent were with the households, 24 percent were with the commercial warehouses and 46 percent with the NFA depositories.
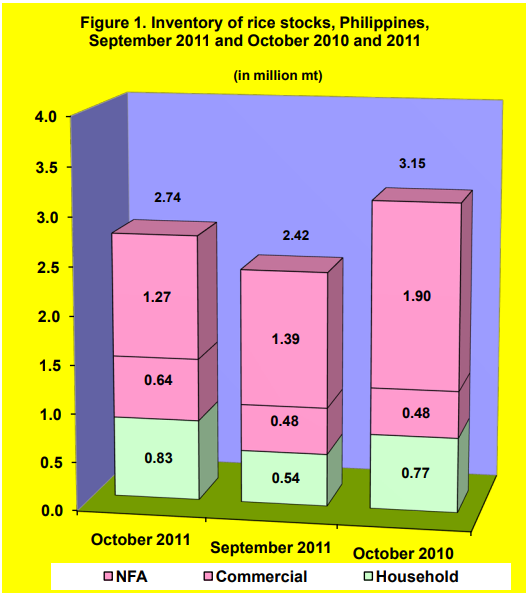
Table 1. Percentage change in the inventory of rice stocks,
Philippines, September 2011 and October 2010 and 2011
CORN
- The October 1, 2011 total corn stock inventory was estimated at 265.2 thousand metric tons (Figure 2). This was 5.2 percent below last month’s record of 279.6 thousand metric tons and 25.1 percent less than last year’s level of 354.0 thousand metric tons (Table 2).
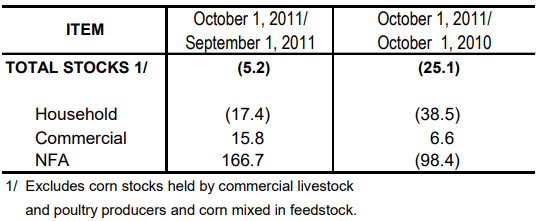
- Compared with last month’s inventory report, household stocks dropped by 17.4 percent. However, stocks in commercial warehouses grew by 15.8 percent, those in NFA depositories recorded a significant increase of 166.7 percent.
- Compared to last year’s records, stocks in the households were down by 38.5 percent and those in NFA depositories by 98.4 percent. On the other hand, stocks in commercial warehouses were higher by 6.6 percent.
- Around 55 percent of the total corn stocks were with the households, and 45 percent were with the commercial warehouses.
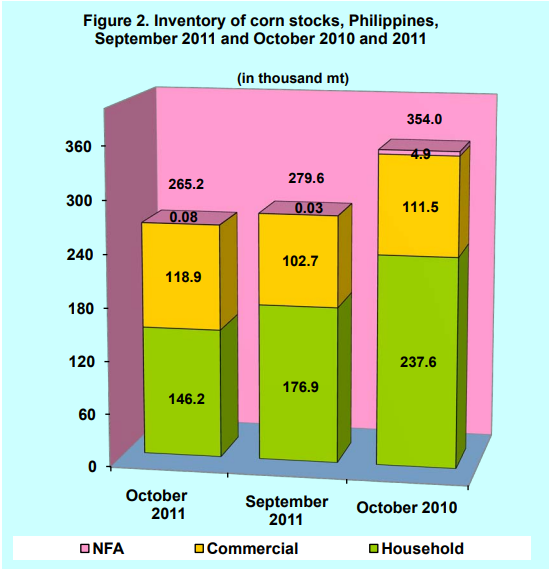
Table 2. Percentage change in the inventory of corn stocks,
Philippines, September 2011 and October 2010 and 2011
| Attachment | Size |
|---|---|
|
|
182.23 KB |