
Release Date :
RICE
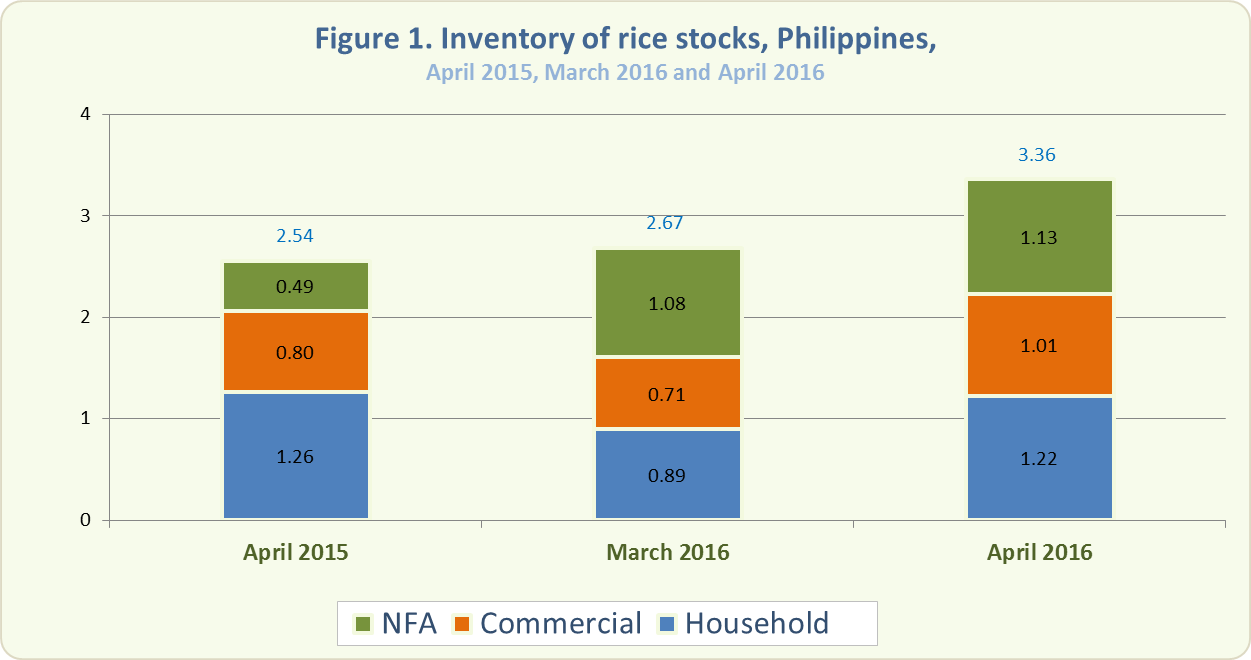
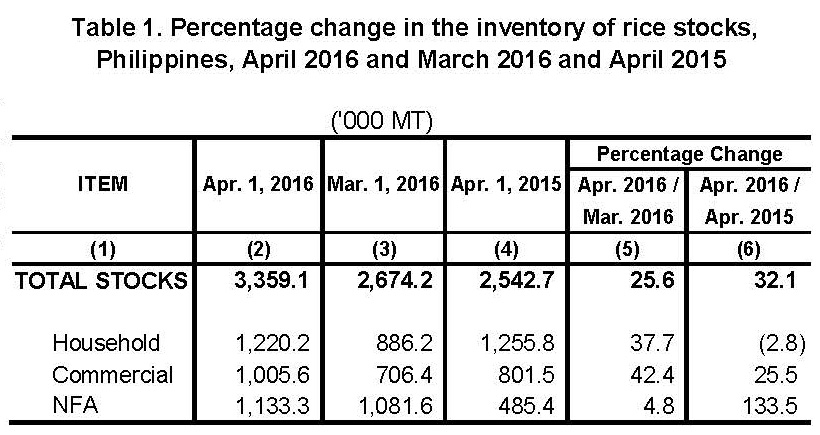
- As of April 1, 2016, the total rice stock inventory was 3.36 million metric tons (Figure 1). This was 32.1 percent above the 2.54 million metric tons level in April 2015 and 25.6 percent higher than last month’s inventory level of 2.67 million metric tons (Table 1).
- Year-on-year, rice stocks in commercial warehouses and NFA depositories grew by 25.5 percent and 133.5 percent, respectively. On the other hand, stocks in the households dropped by 2.8 percent from last year’s inventory of 1.26 million metric tons(Table 1).
- This month’s rice stocks in all sectors increased compared with their levels last month. Stocks in the households increased by 37.7 percent, in commercial warehouses by 42.4 percent, and in NFA depositories by 4.8 percent (Table 1).
- Of this month’s total rice stock inventory, 36.4 percent were with the households, 29.9 percent in commercial warehouses, and 33.7 percent were in NFA depositories. The latter, comprised 87.2 percent of imported rice.
- The total rice inventory for this month would be adequate for 99 days. Stocks in the households would be enough for 36 days, those in NFA depositories for 33 days, and those in commercial warehouses for 30 days.
CORN
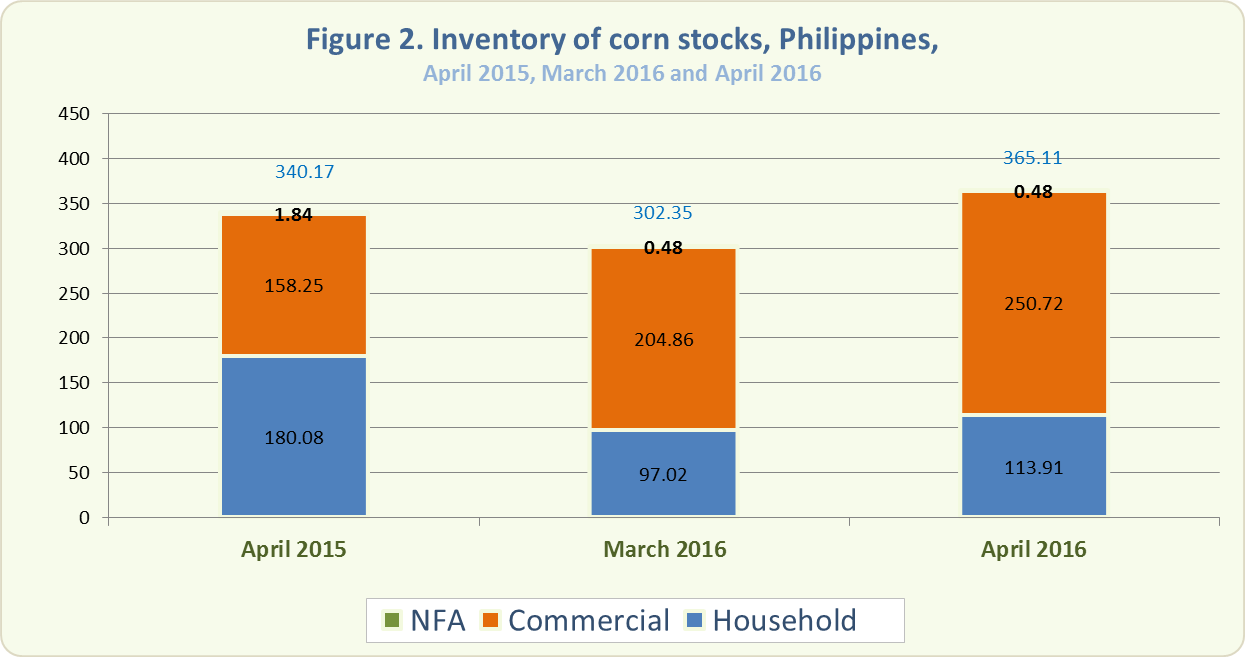
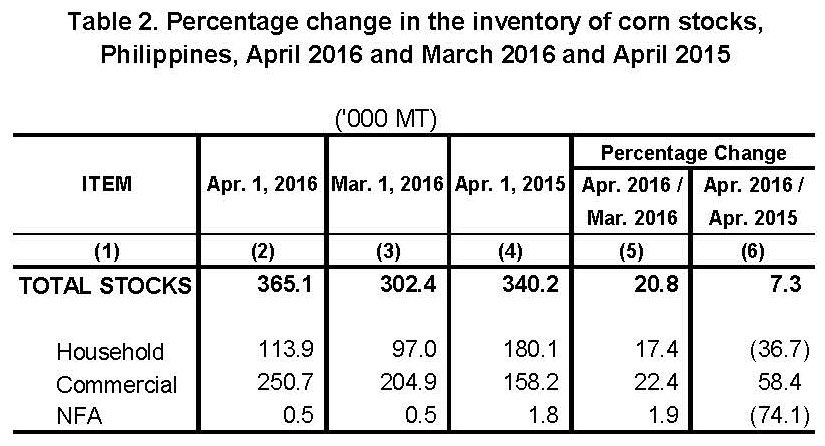
- The total corn stock inventory as of April 1, 2016, was 365.1 thousand metric tons (Figure 2). This was 7.3 percent higher than last year’s record of 340.2 thousand metric tons and 20.8 percent higher than last month’s level of 302.4 thousand metric tons (Table 2).
- Compared with last year, corn stocks in commercial warehouses increased by 58.4 percent. However, stocks in the households and in NFA depositories decreased by 36.7 percent and 74.1 percent, respectively (Table 2).
- This month’s corn stocks in all sectors increased compared with their levels last month. Corn stocks in the households increased by 17.4 percent, in commercial warehouses by 22.4 percent, and in NFA depositories by 1.9 percent.
- Around 68.7 percent of this month’s total corn stock inventory were in commercial warehouses, 31.2 percent were with the households, and 0.1 percent in NFA depositories.
| Attachment | Size |
|---|---|
|
|
480.21 KB |