
Release Date :
RICE
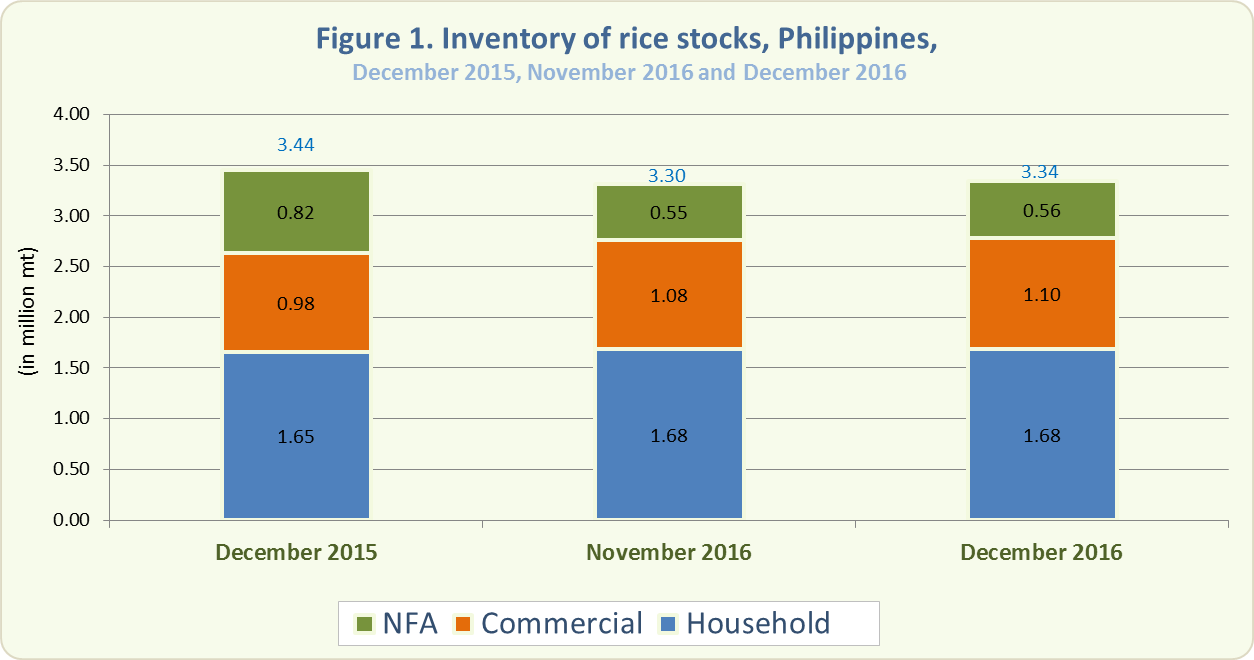
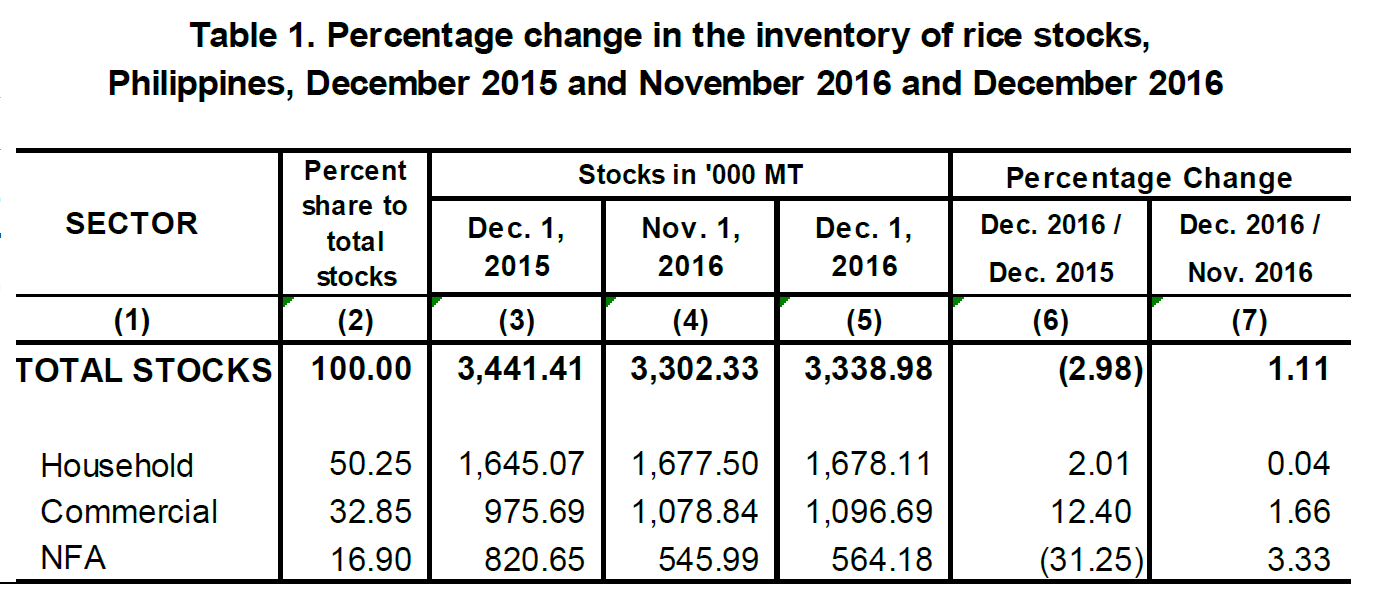
- As of December 1, 2016, the total rice stock inventory was 3.34 million metric tons (Figure 1). This was 2.98 percent lower than the 3.44 million metric tons level in December 2015 but 1.11 percent higher than last month’s inventory level of 3.30 million metric tons (Table 1).
- Compared with last year, rice stocks in the households and in commercial warehouses increased by 2.01 percent and 12.40 percent, respectively. On the other hand, stocks in NFA depositories decreased by 31.25 percent (Table 1).
- This month’s rice stocks in all sectors grew compared with their levels last month. Stocks in the households increased by 0.04 percent, in commercial warehouses by 1.66 percent, and in NFA depositories by 3.33 percent (Table 1).
- Of this month’s total rice stock inventory, 50.25 percent were with the households, 32.85 percent were in commercial warehouses, and 16.90 percent were in NFA depositories. The latter comprised 79.35 percent of imported rice.
- The total rice inventory for this month would be adequate for 98 days. Stocks in the households would be good for 49 days, those in commercial warehouses for 32 days, and those in NFA depositories for 17 days.
CORN
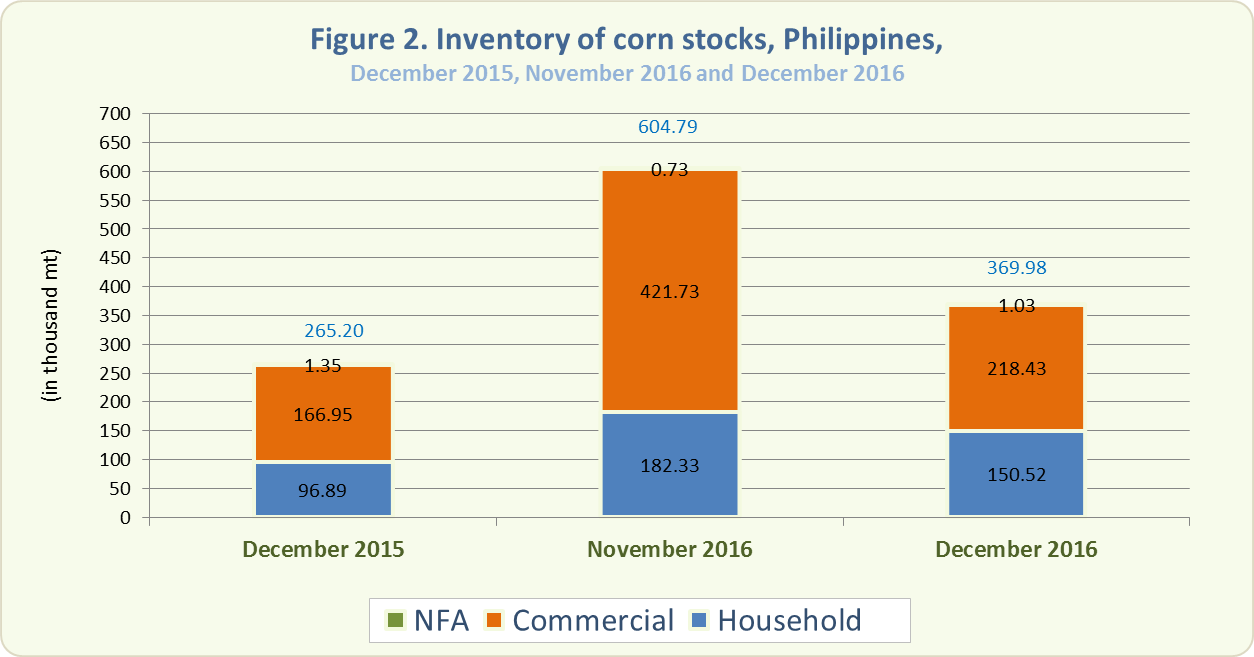
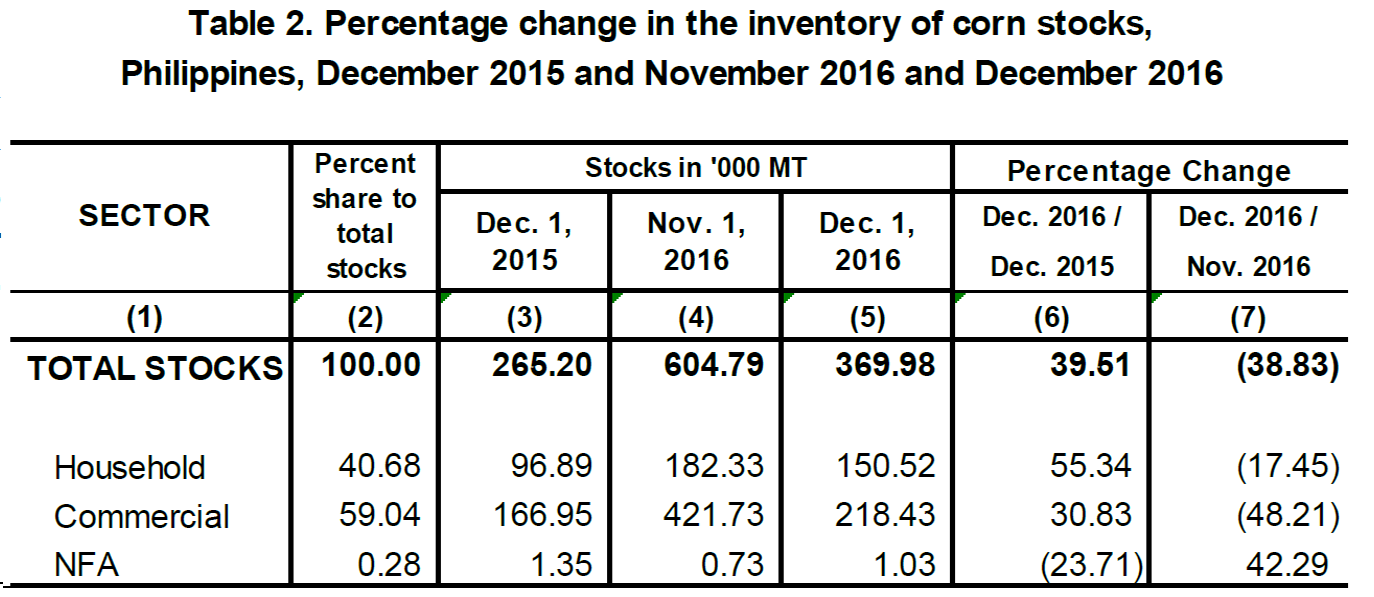
- The total corn stock inventory as of December 1, 2016 was 369.98 thousand metric tons (Figure 2). This was 38.83 percent lower than last year’s record of 265.20 thousand metric tons but 39.51 percent higher than last month’s level of 604.79 thousand metric tons (Table 2).
- Year-on-year, corn stocks in the households and in commercial warehouses grew by 55.34 percent and 30.83 percent, respectively. However, stocks in NFA depositories dropped by 23.71 percent (Table 2).
- Month-on-month, corn stocks in NFA depositories increased by 42.29 percent. On the other hand, stocks in the households and in commercial warehouses decreased by 17.45 percent and 48.21 percent, respectively (Table 2).
- Around 59.04 percent of this month’s total corn stock inventory were in commercial warehouses, 40.68 percent were with the households, and 0.28 percent in NFA depositories.
Technical Notes
Monthly rice and corn stocks inventory are generated from three sectors, namely: household, commercial, and National Food Authority (NFA). The household stocks are taken from the Palay and Corn Stocks Survey (PCSS1) of the PSA, which covers farming and non-farming households nationwide. The commercial stocks are sourced from registered grains businessmen through the Commercial Stocks Survey (CSS), conducted by the NFA, the results of which are submitted to PSA. NFA stocks are monitored from their warehouses/depositories.
| Attachment | Size |
|---|---|
|
|
447.23 KB |