
Release Date :
RICE STOCK
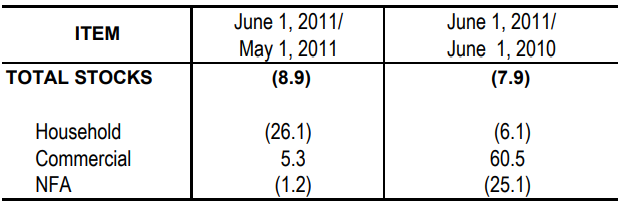
- The total rice stock inventory as of June 1, 2011 was 3.09 million metric tons (Figure 1). The volume of stocks was lower by 8.9 percent from last month’s level of 3.40 million metric tons and 7.9 percent below last year’s record of 3.36 million metric tons (Table 1).
- Relative to last month’s inventory levels, household stocks went down by 26.1 percent. NFA stocks of which 69 percent were imported rice, were lower by 1.2 percent. In contrast, stocks in commercial warehouses were higher by 5.3 percent.
- Compared to last year’s levels, stocks held by households dropped by 6.1 percent and those in NFA depositories went down by 25.1 percent. However, stocks in commercial warehouses increased by 60.5 percent.
- As of June 1, 2011, the total volume of rice stocks would be enough for 91 days. Stocks in NFA depositories would be good for 42 days, while those in commercial warehouses would be good for 22 days. Household stocks would last for 27 days.
- Of this month’s rice stocks, about 29 percent were with the households, 24 percent were with the commercial warehouses and 47 percent were with the NFA depositories.

Table 1. Percentage change in the inventory of rice stocks,
Philippines, May 2011 and June 2010 and 2011
CORN STOCK
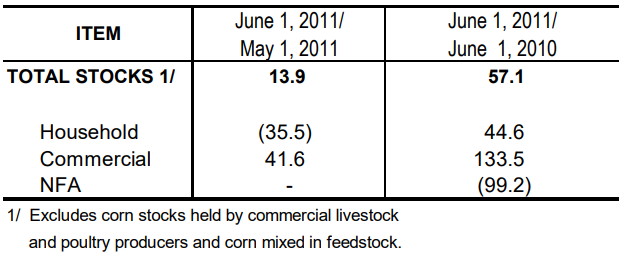
- As of June 1, 2011, the total corn stocks was 234.8 thousand metric tons (Figure 2). This was 13.9 percent more than last month’s level of 206.2 thousand metric tons, and 57.1 percent higher than last year’s record of 149.5 thousand metric tons (Table 2).
- Comparisons with last month’s stock levels showed significant decrease of 35.5 percent in the household stocks. On the other hand, stocks in commercial warehouses grew by 41.6 percent. Stocks in NFA depositories recorded no change from last month’s inventory.
- Compared to last year’s records, stocks in the households went up by 44.6 percent and those in commercial warehouses by 133.5 percent. In contrast, stocks in NFA depositories dropped by 99.2 percent.
- Around 79.6 percent of the current total stocks were with the commercial warehouses, and 20.3 percent were with the households. NFA stocks accounted for 0.1 percent.

Table 2. Percentage change in the inventory of corn stocks,
Philippines, May 2011 and June 2010 and 2011
| Attachment | Size |
|---|---|
|
|
120.93 KB |