
Release Date :
RICE
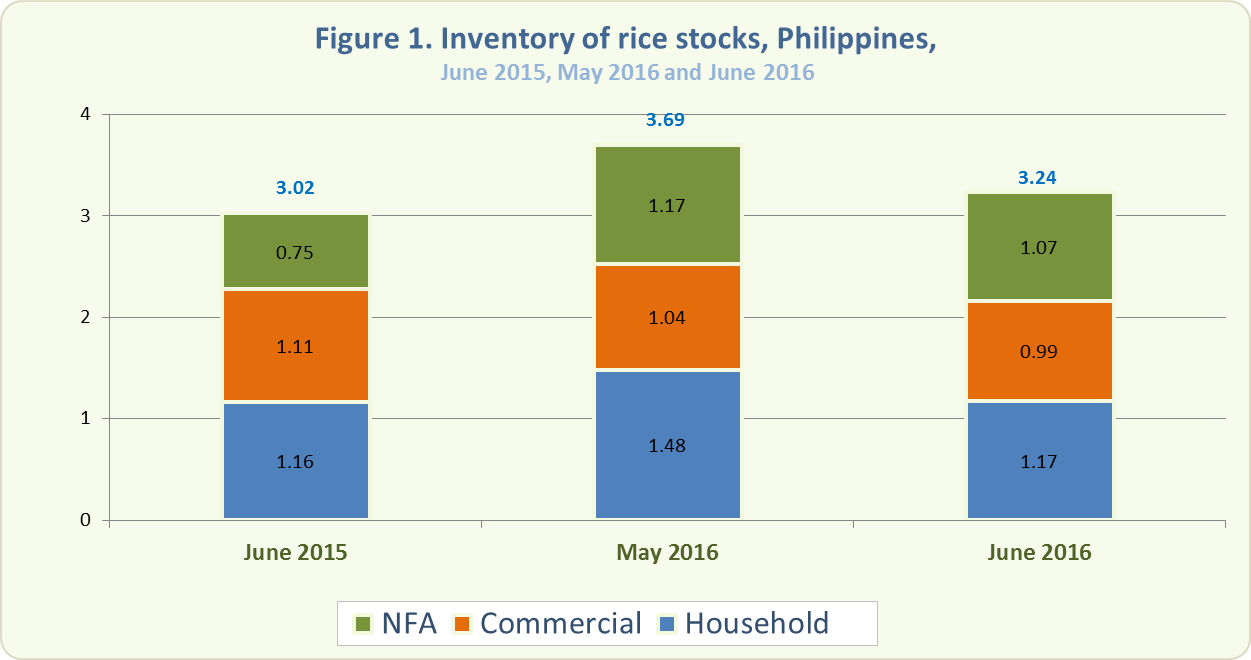
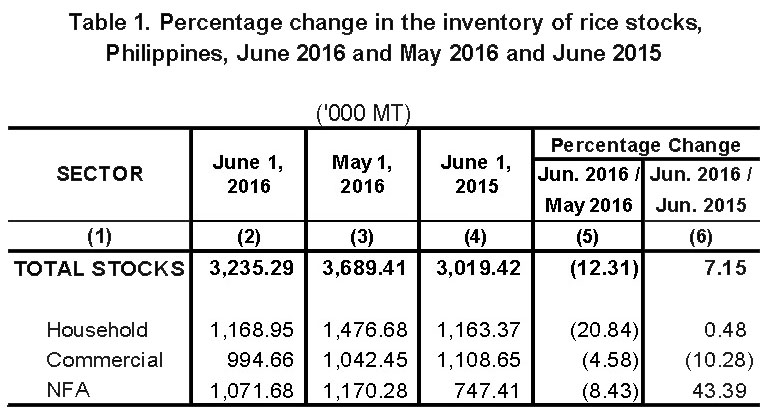
- As of June 1, 2016, the total rice stock inventory was 3.24 million metric tons (Figure 1). This was 7.15 percent higher than the 3.02 million metric tons level in June 2015 but 12.31 percent lower than last month’s inventory level of 3.69 million metric tons (Table 1).
- Year-on-year, rice stocks in the households and in NFA depositories increased by 0.48 percent and 43.39 percent, respectively. On the other hand, stocks in the commercial warehouses decreased by 10.28 percent (Table 1).
- This month’s rice stocks in all sectors were lower compared with their levels last month. Stocks in the households dropped by 20.84 percent, in commercial warehouses by 4.58 percent, and in NFA depositories by 8.43 percent (Table 1).
- Of this month’s total rice stock inventory, 36.13 percent were with the households, 30.74 percent in commercial warehouses, and 33.13 percent were in NFA depositories. The latter comprised 85.39 percent of imported rice.
- The total rice inventory for this month would be good for 95 days. Stocks in the households would be sufficient for 34 days, those in NFA depositories for 32 days, and those in commercial warehouses for 29 days.
CORN
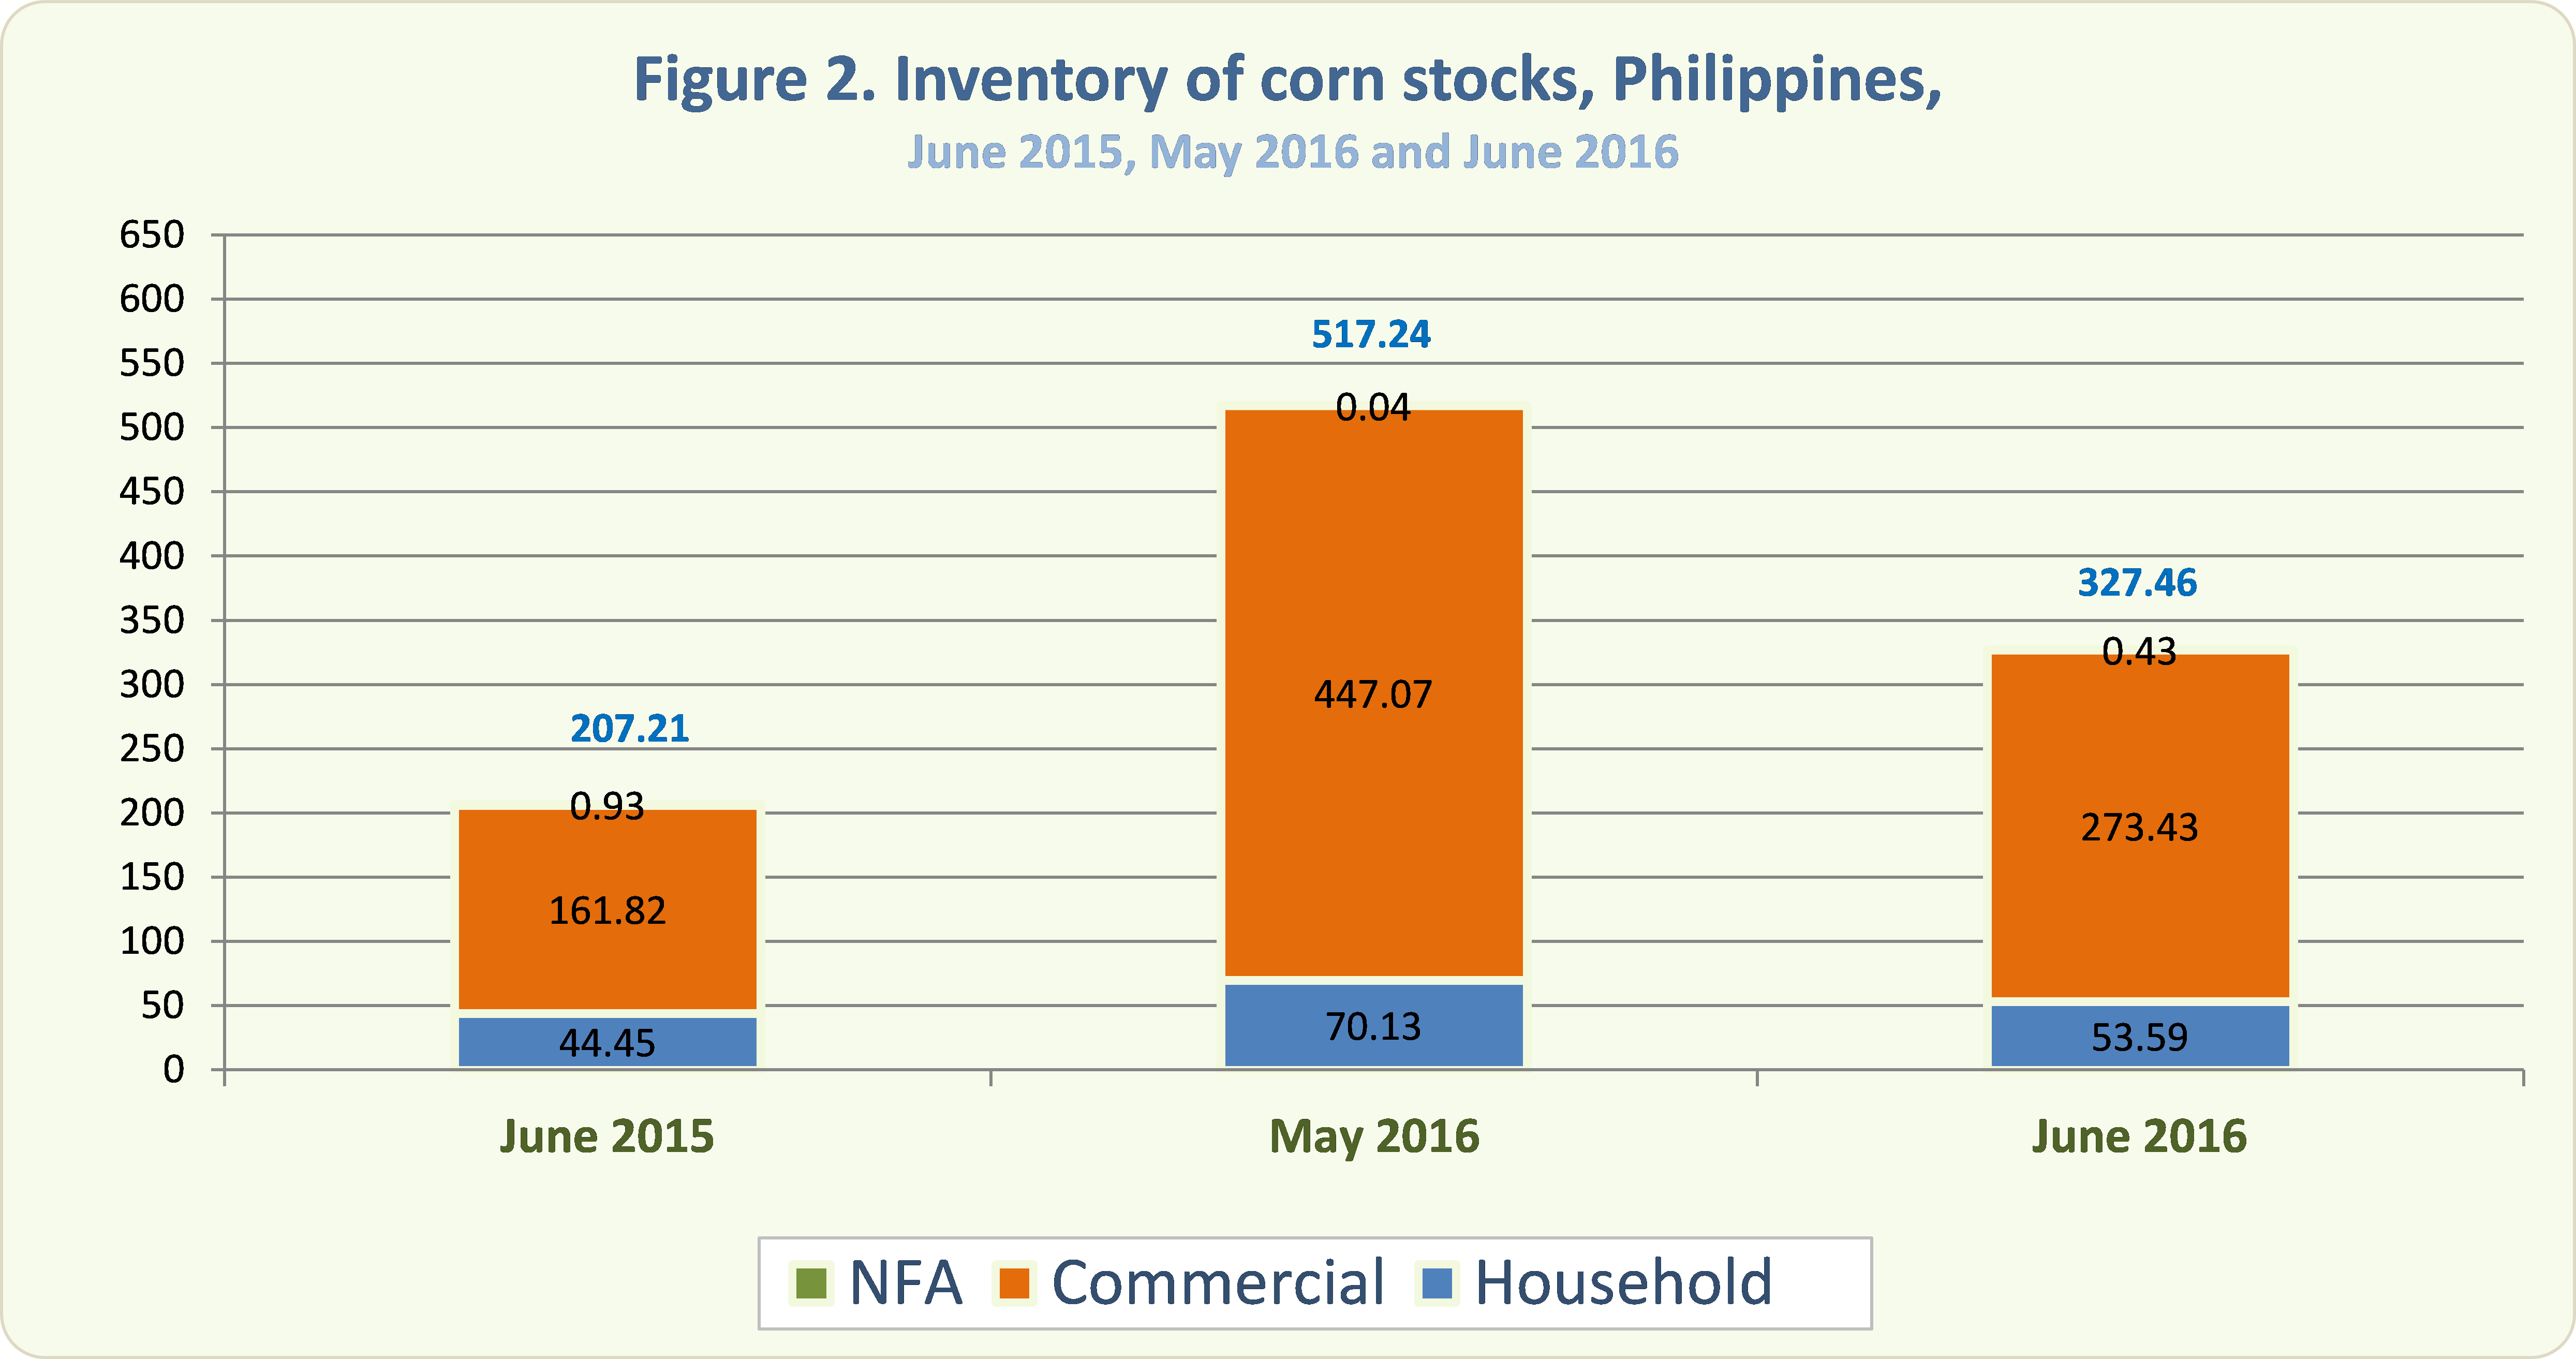
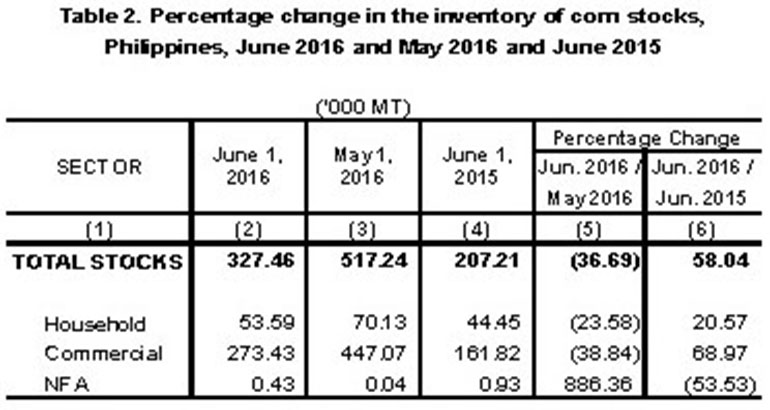
- The total corn stock inventory as of June 1, 2016 was 327.46 thousand metric tons (Figure 2). This was 58.04 percent higher than last year’s record of 207.21 thousand metric tons but 36.69 percent lower than last month’s level of 517.24 thousand metric tons (Table 2).
- Compared with last year, corn stocks in the households and in commercial warehouses grew by 20.57 percent and 68.97 percent, respectively. However, stocks in NFA depositories dropped by 53.53 percent (Table 2).
- Compared with last month, corn stocks in NFA depositories increased by 886.36 percent. On the other hand, stocks in the households and in commercial warehouses decreased by 23.58 percent and 38.84 percent, respectively.
- Around 83.50 percent of this month’s total corn stock inventory were in commercial warehouses, 16.37 percent were with the households, and 0.13 percent in NFA depositories.
Technical Notes
Monthly rice and corn stocks inventory are sourced out from three sectors, namely: household, commercial, and National Food Authority (NFA). The household stocks are taken from the Palay and Corn Stocks Survey (PCSS1) of the PSA, which covers farming and non-farming households nationwide. The commercial stocks are monitored by the NFA among their registered grains businessmen through the Commercial Stock Survey (CSS). NFA stocks are monitored from their warehouses/depositories.
| Attachment | Size |
|---|---|
|
|
669.36 KB |