
Release Date :
RICE
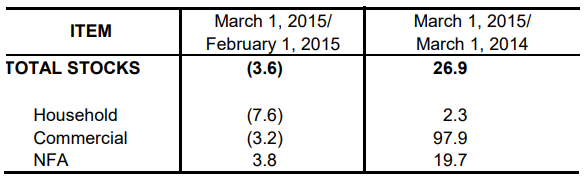
- The total rice stock inventory as of March 1, 2015 was 2.27 million metric tons (Figure 1). This was 26.9 percent above the 1.78 million metric tons record in March 2014, but 3.6 percent lower than last month’s inventory of 2.35 million metric tons (Table 1).
- This month’s rice stock levels in all sectors were higher compared to their respective levels in the same period last year. Stocks in the households increased by 2.3 percent, in commercial warehouses by 97.9 percent, and in NFA depositories by 19.7 percent.
- Compared with last month, rice stocks in NFA depositories, with 96.2 percent imported rice, grew by 3.8 percent. However, stocks in the households and in commercial warehouses decreased by 7.6 percent and 3.2 percent, respectively.
- Around 42.8 percent of this month’s total rice stock inventory were with the households, 32.9 percent in commercial warehouses and 24.3 percent in NFA depositories.
- The total rice inventory for this month would be enough for 67 days. Stocks in the households would be good for 29 days. Those in commercial warehouses would be adequate for 22 days, and in NFA depositories for 16 days.
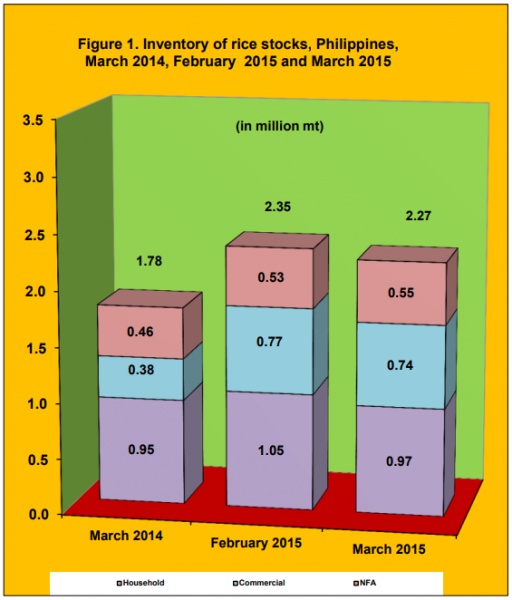
Table 1. Percentage change in the inventory of rice stocks,
Philippines, March 2014 and February 2015 and March 2015
CORN
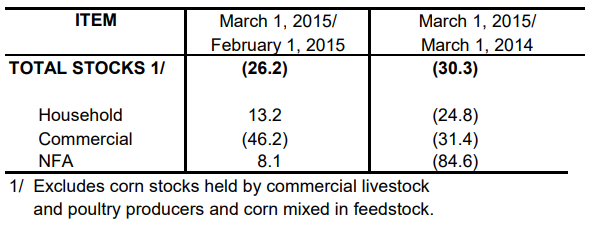
- As of March 1, 2015, the total corn stock inventory was 186.5 thousand metric tons (Figure 2). This was 30.3 percent lower than last year’s record of 267.8 thousand metric tons and 26.2 percent less than last month’s level of 252.8 thousand metric tons (Table 2).
- This month’s corn stocks in all sectors were lower compared with their respective levels in the same period last year. Stock levels in the household dropped by 24.8 percent, in commercial warehouses by 31.4 percent, and in NFA depositories by 84.6 percent.
- Month-on-month, corn stock level in the households and in NFA depositories increased by 13.2 percent and 8.1 percent, respectively. On the other hand, stock level in commercial warehouses decreased by 46.2 percent.
- Around 50.7 percent of this month’s total corn stock inventory were with the households, 48.4 percent were in commercial warehouses and 0.9 percent were in NFA depositories.
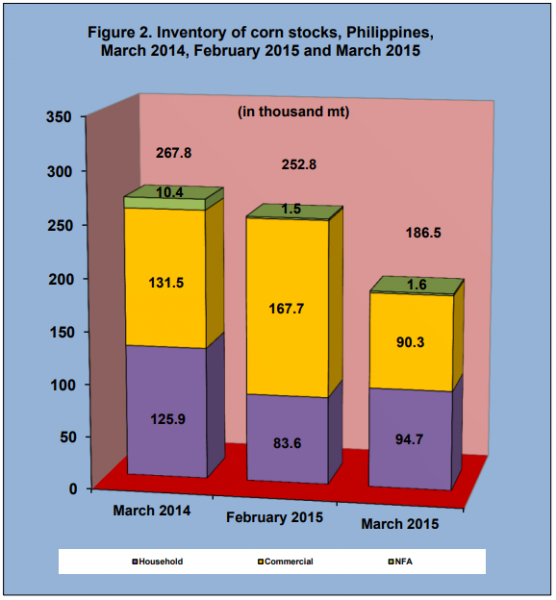
Table 1. Percentage change in the inventory of rice stocks,
Philippines, March 2014 and February 2015 and March 2015
| Attachment | Size |
|---|---|
|
|
323.03 KB |