
Release Date :
RICE
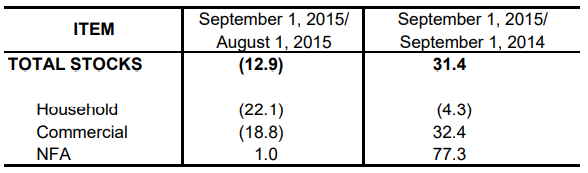
- The total rice stock inventory as of September 1, 2015 was 1.96 million metric tons (Figure 1). This was 31.4 percent above the 1.49 million metric tons level in September 2014 but 12.9 percent lower than last month’s inventory of 2.24 million metric tons (Table 1).
- Compared with last year, rice stocks in commercial warehouses and in NFA depositories were higher by 32.4 percent and 77.3 percent, respectively. On the other hand, stock levels in the households decreased by 4.3 percent.
- Month-on-month, stocks in NFA depositories, with 91.8 percent imported rice, grew by 1.0 percent. However, stocks in the households and in commercial warehouses dropped by 22.1 percent and 18.8 percent, respectively.
- Of this month’s total rice stock inventory, 41.0 percent were in NFA depositories; 29.7 percent in the commercial warehouses; and 29.2 percent were with the households.
- The total rice inventory for this month would be sufficient for 58 days. Stocks in NFA depositories would be enough for 24 days. Those in the households and in commercial warehouses would be good for 17 days each.
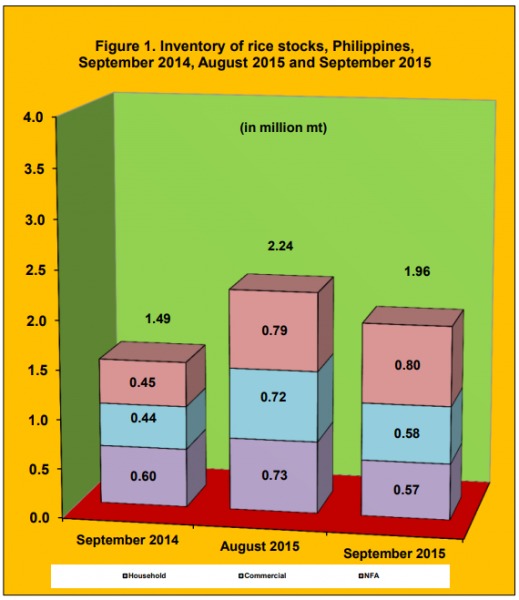
Table 1. Percentage change in the inventory of rice stocks,
Philippines, September 2014 and August 2015 and September 2015
CORN
- As of September 1, 2015, the total corn stock inventory was 329.0 thousand metric tons (Figure 2). This was 17.5 percent higher than last year’s record of 280.0 thousand metric tons and 5.0 percent more than last month’s level of 313.3 thousand metric tons (Table 2).
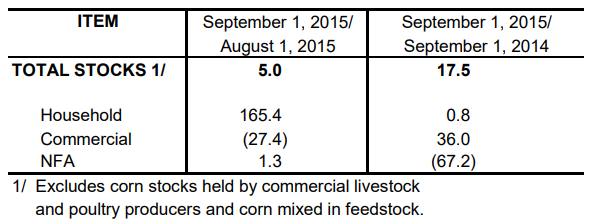
- Year-on-year, corn stocks in commercial warehouses and in the households increased by 36.0 percent and 0.8 percent, respectively. Those in NFA depositories decreased by 67.2 percent.
- Compared with last month, stocks in the households and in NFA depositories went up by 165.4 percent and 1.3 percent, respectively. Stocks in commercial warehouses were down by 27.4 percent.
- Around 57.3 percent of this month’s total corn stock inventory were in commercial warehouses, 42.4 percent were with the households, and 0.3 percent in NFA depositories.
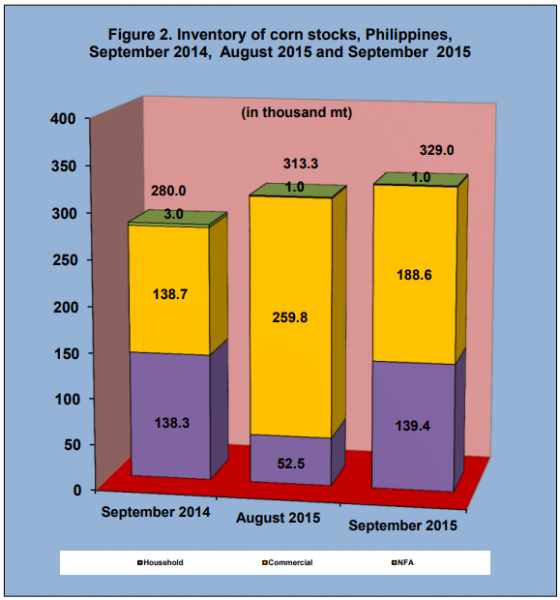
Table 1. Percentage change in the inventory of corn stocks,
Philippines, September 2014 and August 2015 and September 2015
| Attachment | Size |
|---|---|
|
|
316.65 KB |