
Summary Inflation Report Consumer Price Index (2018=100): June 2024
OCTOBER AND SEPTEMBER 2010
| Year-on-Year Inflation Rates, All Items | |||
| October | September | Year-to-date | |
| Philippines | |||
| Headline | 2.8 | 3.5 | 4.0 |
| Core | 3.3 | 3.8 | 3.7 |
| NCR | |||
| Headline | 2.2 | 3.5 | 4.1 |
| AONCR | |||
| Headline | 2.9 | 3.5 | 3.9 |
The year-on-year headline inflation rate in the Philippines continued to move at a slower pace of 2.8 percent in October from 3.5 percent in September. This was triggered by the deceleration in the inflation rates of food, beverages and tobacco (FBT, fuel, light and water (FLW) and miscellaneous items index. Inflation a year ago was 1.6 percent.
Excluding selected food and energy items, core inflation decelerated to 3.3 percent in October from 3.8 percent in September.
The annual inflation rate in the National Capital Region (NCR) likewise eased to 2.2 percent in October from 3.5 percent in September as a negative annual rate was posted in the heavily weighted FBT index. Slower annual price gains in clothing, FLW and miscellaneous items index also contributed to the downtrend.
Annual inflation rate in Areas Outside the National Capital Region (AONCR) further slowed down to 2.9 percent in October from 3.5 percent in September. This was effected by the lower annual growth rates in the indexes of FBT, FLW and miscellaneous items. 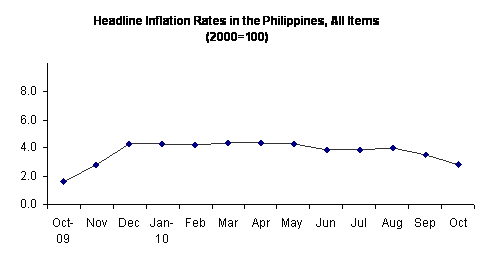
| Year-on-Year Inflation Rates in the Philippines, All Items January 2005 - October 2010 | ||||||
| Month | Year | |||||
| 2005 | 2006 | 2007 | 2008 | 2009 | 2010 | |
| January | 8.4 | 6.7 | 3.9 | 4.9 | 7.1 | 4.3 |
|---|---|---|---|---|---|---|
| February | 8.5 | 7.6 | 2.6 | 5.4 | 7.3 | 4.2 |
| March | 8.5 | 7.6 | 2.2 | 6.4 | 6.4 | 4.4 |
| April | 8.5 | 7.1 | 2.3 | 8.3 | 4.8 | 4.4 |
| May | 8.5 | 6.9 | 2.4 | 9.5 | 3.3 | 4.3 |
| June | 7.6 | 6.7 | 2.3 | 11.4 | 1.5 | 3.9 |
| July | 7.1 | 6.4 | 2.6 | 12.3 | 0.2 | 3.9 |
| August | 7.2 | 6.3 | 2.4 | 12.4 | 0.1 | 4.0 |
| September | 7.0 | 5.7 | 2.7 | 11.8 | 0.6r | 3.5 |
| October | 7.0 | 5.4 | 2.7 | 11.2 | 1.6 | 2.8 |
| November | 7.1 | 4.6 | 3.2 | 9.9 | 2.8 | |
| December | 6.7 | 4.3 | 3.9 | 8.0 | 4.3r | |
| Average | 7.6 | 6.2 | 2.8 | 9.3 | 3.2 | |
| Month-on-Month Inflation Rates, All Items | ||
| October | September | |
| Philippines | -0.2 | -0.2 |
| NCR | -0.2 | -0.8 |
| AONCR | -0.2 | -0.1 |
-
Consumer prices continued to decline at -0.2 percent in October. This was brought about by lower electricity rates in selected regions including NCR. Price reductions in some food items such as rice, corn, eggs, vegetables and chicken in selected regions also contributed to the downward movement.
CONSUMER PRICE INDEX
(2000=100)
OCTOBER 2010
By Region, Year-on-Year
-
The year-on-year inflation rate in NCR further decelerated to 2.2 percent in October from 3.5 percent in September.
-
Similarly, annual inflation in AONCR slowed to 2.9 percent in October from 3.5 percent in September as twelve regions posted slower annual growth rates. The biggest decline of 1.2 percentage points were seen in Cagayan Valley (1.7% from 2.9%) and CALABARZON (3.0% from 4.2%). The lowest annual growth among the regions was in Ilocos at 1.6 percent while the highest rate at 6.0 percent was still in ARMM.
By Commodity Group, Year-on-Year
-
At the national level, slowdowns in the annual price hike were posted in the heavily weighted FBT index at 2.0 percent in October from 3.2 percent in September; FLW, 8.3 percent from 11.9 percent; and miscellaneous items, 1.2 percent from 1.3 percent. On the other, the annual rates of increases were higher in H&R and services index at 1.8 percent and 3.7 percent from their corresponding previous month’s annual growths of 1.6 percent and 3.2 percent. Annual inflation for clothing remained at 1.9 percent.
The overall annual inflation for food alone further slowed to 2.0 percent in October from 3.3 percent in September.
A negative annual rate of price movement was noted in the fruits and vegetables index at -7.5 percent in October from 0.6 percent in September. Moreover, the annual price increment in the rice index slid to 1.4 percent in October from 1.5 percent in September; corn, 0.5 percent from 1.2 percent; cereal preparations, 2.9 percent from 3.1 percent; eggs, 3.1 percent from 3.4 percent; meat, 2.4 percent from 3.8 percent; and miscellaneous foods, 7.1 percent from 7.3 percent. The annual price hike in dairy products index remained at 1.6 percent and fish, 2.0 percent.
-
In NCR, the FBT index declined on annual basis by -1.0 percent in October from 1.2 percent in September. In addition, the annual price gain in clothing index was slower at 1.2 percent from 1.4 percent; FLW, 10.9 percent from 19.2 percent; and miscellaneous items, 0.7 percent from 0.8 percent. On the other hand, higher annual price uptick was seen in H&R at 2.1 percent from 1.5 percent and services index, 3.1 percent from 2.8 percent.
-
A negative rate of price adjustment was registered in the food alone index in NCR at -1.2 percent in October from 1.2 percent in September.
-
The annual price change in the rice index was still negative at -0.3 percent in October from -0.2 percent in September; fruits and vegetables, -20.4 percent from -7.2 percent and in meat, -0.2 percent from 2.1 percent. A slower annual price adjustment was also noticed in corn index at 11.6 percent from 12.1 percent; cereal preparations, 2.0 percent from 2.1 percent; eggs, 3.0 percent from 3.4 percent; and miscellaneous foods, 3.5 percent from 3.6 percent. On the contrary, a higher annual price increase was posted in fish index at 2.2 percent from 1.4 percent while that dairy products index remained at 1.3 percent.
-
-
In AONCR, the annual growth in the FBT index slid to 2.8 percent in October from 3.8 percent in September; FLW, 6.9 percent from 8.1 percent; and miscellaneous items, 1.3 percent from 1.5 percent. The annual inflation in the services index was however higher at 3.1 percent from 2.8 percent while those for clothing and H&R index remained at their previous month’s rates of 2.1 percent and 1.6 percent, respectively.
-
The annual increase in the food alone index in AONCR improved to 2.9 percent in October from 3.9 percent in September as all the food groups except dairy products posted either negative or slower annual rates.
-
A negative annual price movement was seen in fruits and vegetables index at -2.9 percent in October from 3.0 percent in September.
-
The annual price change was slower in rice index at 1.7 percent from 1.8 percent as nine regions registered either negative or lower annual price adjustment. The biggest deceleration of 2.1 percentage points (5.1% from 7.2%) was in ARMM. The lowest annual rate of -2.2 percent was in Cagayan Valley.
-
A slower annual inflation was also seen in the corn index at 0.3 percent in October from 1.0 percent in September; cereal preparations, 3.2 percent from 3.5 percent; eggs, 3.0 percent from 3.4 percent; fish, 1.9 percent from 2.2 percent; meat, 3.6 percent from 4.6 percent; and miscellaneous foods, 8.6 percent from 8.9 percent. Annual inflation for dairy products index remained at 1.6 percent.
-
By Region, Month-on-Month
A negative monthly price change was still noticed in NCR at -0.2 percent in October from -0.8 percent in September as prices of FLW items further dropped to -7.1 percent from -4.8 percent. Higher price gains were however recorded in FBT and services index at 0.5 percent from -0.4 percent and H&R, 1.0 percent from zero growth while those for clothing and miscellaneous items were zero.
Prices in AONCR further declined to -0.2 percent in October from -0.1 percent in September due to the -0.3 percent drop in the heavily weighted FBT index from zero growth. Prices of FLW items also continued to decline at -0.7 percent from -0.8 percent. A slower price increase in H&R index at 0.1 percent from 0.2 percent also contributed to the downtrend. The miscellaneous items index had a zero growth from 0.1 percent. On the other hand, price uptick in the services index was higher at 0.2 percent from -0.2 percent.
Eight regions posted negative rates of monthly price movements with CALABARZON recording the lowest monthly rate at -0.5 percent. The highest month-on-month inflation rate was in Central Visayas at 0.4 percent.
Price decreases were noted in Luzon and Mindanao while prices in Visayas generally picked up during the month.
By Commodity Group, Month-on-Month
-
A -0.2 percent drop in the overall consumer prices was still observed in October. Prices of FLW items further went down to -3.0 percent from -2.2 percent and FBT items moved at its last month’s rate of -0.1 percent. Meanwhile, price hikes in H&R and services index were higher at 0.4 percent and 0.3 percent, respectively from their previous month’s rates of 0.1 percent and -0.2 percent. Price increase in clothing index remained at 0.1 percent while that for miscellaneous items index was zero from 0.1 percent in September.
Price declines in rice were noted in all the regions in AONCR except in Central Visayas, Eastern Visayas and Caraga. Thus, the aggregate rice index in AONCR and in the Philippines went down to -0.6 percent and -0.5 percent, respectively as the harvest season of palay brought sufficient supply of rice in the markets. SOCCSKSARGEN registered the biggest drop in the rice index of -3.1 percent while Eastern Visayas showed the highest rate of 0.3 percent. On the hand, prices of rice in NCR generally remained stable as its index had a zero growth from -0.4 percent.
The sufficient supply of broiler chicken in the markets pushed down its prices in October. Reduced prices of pork in many regions including NCR were also noted during the month. These factors triggered the -0.4 percent drop in the meat index in AONCR and in the Philippines and -0.3 percent in NCR.
The index of fruits and vegetables in the Philippines and AONCR continued to record negative rates of -0.3 percent and -1.5 percent. Sufficient supply of vegetables in the markets particularly fruit vegetables and potato continued, hence, price decreases were observed in the markets. On the contrary, the inclement weather brought by typhoon “Juan” reduced volume of deliveries of vegetables by producers from the Northern Luzon areas in NCR markets. These effected the 4.0 percent price hike in the fruits and vegetables index in the area.
Enough supply of eggs due to the increased number of layers pushed down its group’s index by -0.3 percent in the Philippines, -0.7 percent in NCR; and -0.1 percent in AONCR.
The difficulty in catching fish species brought about by the inclement weather condition that generally prevailed during the month resulted to less supply in the wet markets. Thus, the fish index in NCR went up by 1.1 percent from 0.1 percent. In AONCR, upward adjustments in the prices of shrimps, crabs, shells and mollusks were almost offsetted by the reductions in the prices of fresh and processed fish species in some regions. Hence, the aggregate index of fish in AONCR decreased by -0.1 percent from 0.2 percent. The national index went up to 0.2 percent from 0.1 percent.
Upward adjustments in the prices of cooking oil and sugar raised the miscellaneous foods index in the three areas by 0.1 percent.
-
With lower electricity rates recorded in NCR and in selected regions, the FLW index in the Philippines declined by -3.0 percent; NCR, -7.1 percent; and AONCR, -0.7 percent.
-
The H&R index in the Philippines picked up by 0.4 percent; NCR, 1.0 percent; and AONCR, 0.1 percent. This was due to the increased rental rates in NCR and higher prices of selected construction materials in some regions.
-
Price additions in gasoline and diesel nationwide pushed the services index in the Philippines by 0.3 percent; NCR, 0.5 percent; and AONCR, 0.2 percent. Higher prices of some medicines in selected regions also contributed to the uptrend.
NOTE: CPIs and inflation rates by province and selected city are also available upon request at NSO, Industry and Trade Statistics Department, Economic Indices and Indicators Division (Telephone Numbers: 716-39-35 and 715-33-47).
Source: National Statistics Office
Manila, Philippines
Page last updated: November 5, 2010

