
Summary Inflation Report Consumer Price Index (2018=100): June 2024
AUGUST AND JULY 2011
Year-on-Year Inflation Rates, All Items
August 2011 | July 2011 | Year-to-date | |
| Philippines |
|
|
|
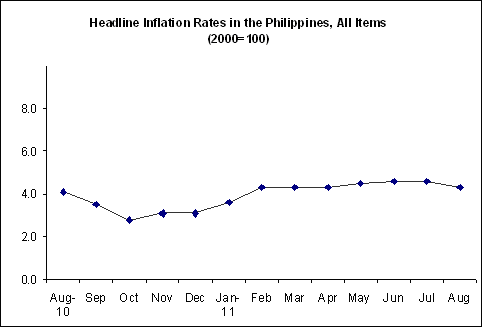
| Headline | 4.3 | 4.6 | 4.3 |
| Core | 3.4 | 3.7 | 3.5 |
| NCR |
|
|
|
| Headline | 3.8 | 4.3 | 4.1 |
| AONCR |
|
|
|
| Headline | 4.5 | 4.7 | 4.4 |
Year-on-Year Inflation Rates in the Philippines, All Items
January 2006 - August 2011
Month | Year | |||||
2006 | 2007 | 2008 | 2009 | 2010 | 2011 | |
|
|
|
|
|
| |
| January | 6.7 | 3.9 | 4.9 | 7.1 | 4.3 | 3.6r |
| February | 7.6 | 2.6 | 5.4 | 7.3 | 4.2 | 4.3 |
| Mar-ch | 7.6 | 2.2 | 6.4 | 6.4 | 4.4 | 4.3 |
| April | 7.1 | 2.3 | 8.3 | 4.8 | 4.5r | 4.3r |
| May | 6.9 | 2.4 | 9.5 | 3.3 | 4.3 | 4.5 |
| June | 6.7 | 2.3 | 11.4 | 1.5 | 4.0r | 4.6 |
| July | 6.4 | 2.6 | 12.3 | 0.2 | 3.9 | 4.6 |
| August | 6.3 | 2.4 | 12.4 | 0.1 r | 4.1r | 4.3 |
| September | 5.7 | 2.7 | 11.8 | 0.6r | 3.5r |
|
| October | 5.4 | 2.7 | 11.2 | 1.6 | 2.8 |
|
| November | 4.6 | 3.2 | 9.9 | 2.8 | 3.1r |
|
| December | 4.3 | 3.9 | 8.0 | 4.3r | 3.1r |
|
|
|
|
|
|
| |
| Average | 6.2 | 2.8 | 9.3 | 3.2 | 3.8 |
|
Month-on-Month Inflation Rates, All Items
August 2011 | July 2011 | |
| Philippines | 0.0 | 0.1 |
| NCR | -0.1 | -0.2 |
| AONCR | 0.1 | 0.2 |
Source: National Statistics Office
Manila, Philippines
Page last updated: September 6, 2011

