
Seasonally Adjusted Palay/Rice Production and Prices, January to March 2024
PRODUCTION
The seasonally adjusted palay production for the second quarter of 2018 was 4.76 million metric tons, slightly lower by 1.85 percent from the 4.85 million metric tons output in the first quarter of 2018 (Table 1).
Figure 1. Quarterly Palay Production, Philippines, 2011-2018
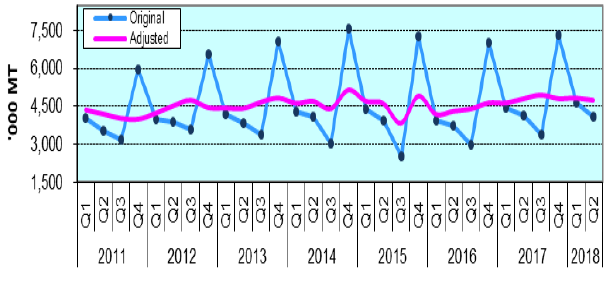
The decline in output was attributed to the decrease in harvest area resulting from early plantings during the last two quarters due to sufficient water supply. Moreover, some farmers harvested in the later part of the first quarter to avail of good prices offered by traders. Downturns in production were large in Cagayan Valley and SOCCSKSARGEN.
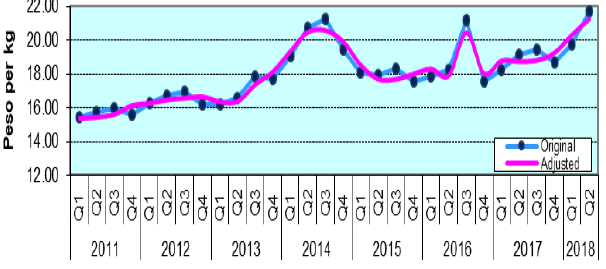
Figure 2. Quartery Farmgate Prices of Palay, Philippines, 2011-2018
This quarter’s performance when deseasonalized was lower by 1.29 percent or 62 thousand metric tons as compared to the last year’s level (Table 1).
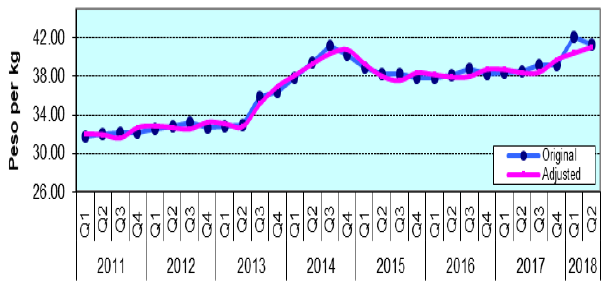
Figure 4. Quarterly Wholesale Prices of Rice, Philippines, 2011-2018
PRICES
In the second quarter of 2018, the seasonally adjusted farmgate, wholesale and retail prices for palay/rice improved by 4.68 percent, 1.51 percent and 1.94 percent from their respective levels in the first quarter of 2018 (Tables 1 and 2).
Figure 4. Quarterly Retail Prices of Rice, Philippines, 2011·2018
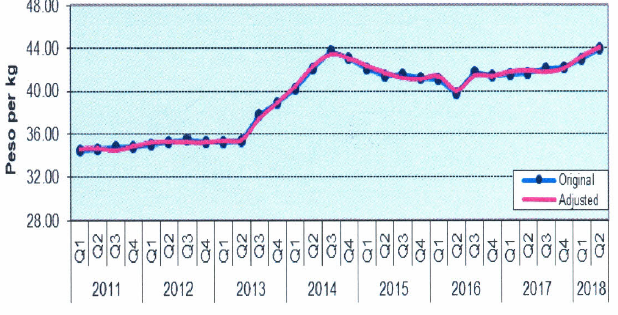
Compared to last year's record, the deseasonalized farmgate, wholesale and retail prices for palay/rice were higher than the last year's quotations by 13.44 percent, 6.93 percent and 5.18 percent, respectively (Tables 1 and 2)
ROSALlNDA P. BAUTISTA
(Director II)
Officer-in-Charge
Sectoral Statistics Office