
Seasonally Adjusted Palay/Rice Production and Prices, January to March 2024
PRODUCTION
The seasonally adjusted palay production for October-December 2017 was 4.81 million metric tons, 2.97 percent lower than the 4.96 million metric tons output in the third quarter of 2017 (Table 1).
The gain in production were attributed to increment in harvest area and yield resulting from sufficient water supply, continuous use of high yielding varieties seeds and close monitoring of pests and diseases during the cropping period. These were mostly shared by Cagayan Valley, Central Luzon, Bicol Region and Central Visayas.
Figure 1. Quarterly Palay Production, Philippines, 2011-27
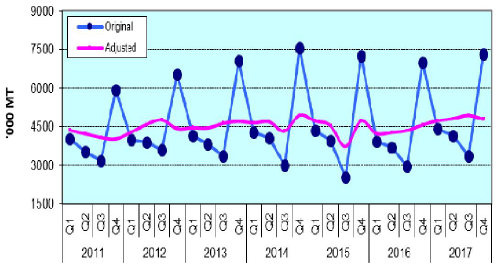
Year on year, this quarter’s performance when deseasonalized was up by 4.93 percent or 226 thousand metric tons (Table 1).
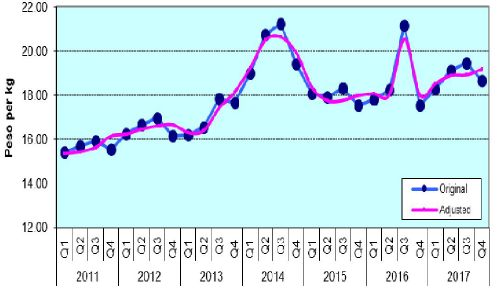
Figure 2. Quarterly Farmgate Prices of Palay, Philippines, 2011-2017
PRICES
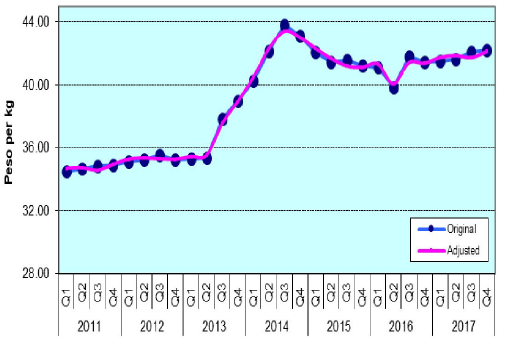
The seasonally adjusted farmgate price for palay in the fourth quarter of 2017 increased by 1.43 percent from the third quarter of 2017 level (Table 1). Likewise, wholesale and retail prices for rice grew by 3.09 percent and 0.91 percent from their respective levels in the previous quarter, respectively (Tables 1 and 2).
Figure 3. Quarterly Wholesale Prices of Rice, Philippines, 2011-2017
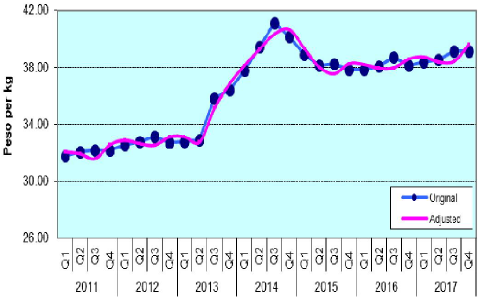
This quarter’s deseasonalized farmgate price for palay was above the previous year’s quotation by 6.61 percent. Wholesale and retail prices for rice were higher by 2.61 percent and 1.79 percent from the previous year’s levels, respectively (Tables 1 and 2).
Figure 4. Quarterly Retail Prices of Rice, Philippines, 2011-2017
ROMEO S. RECIDE
Assistant Secretary
Deputy National Statistician
Sectoral Statistics Office