
Rice and Corn Stocks Inventory, June 2024
RICE.
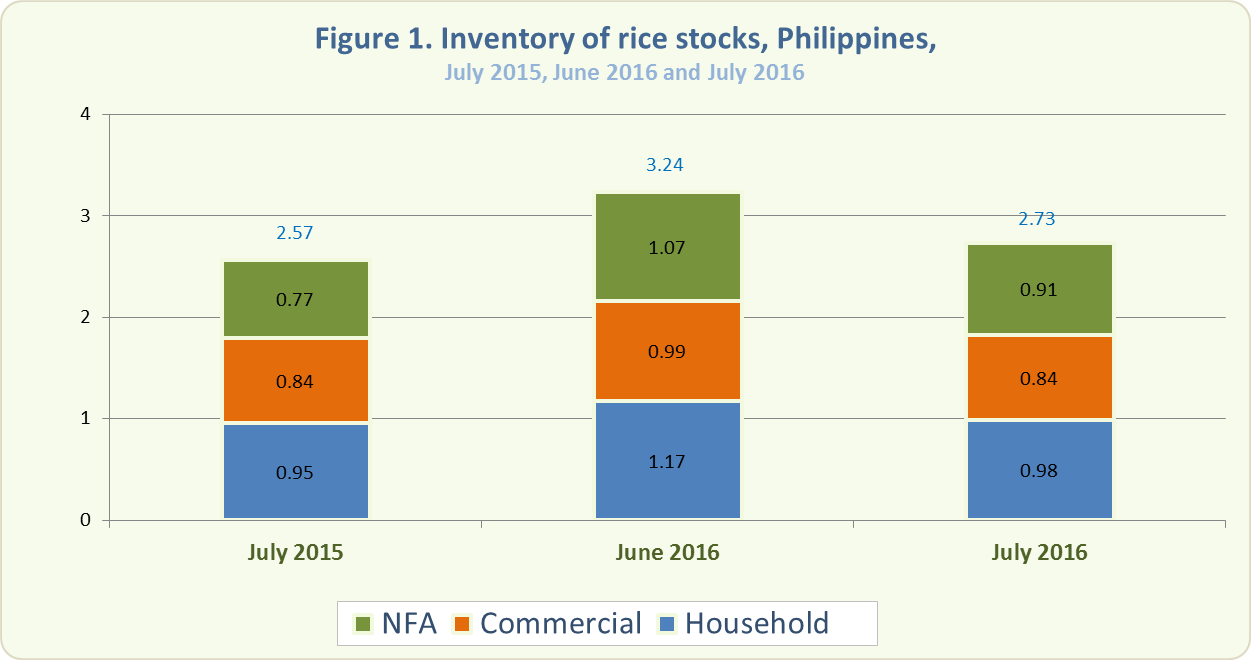
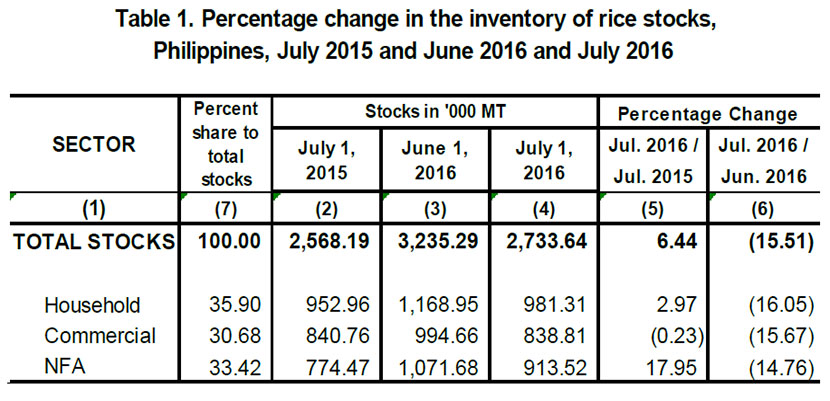
- The total rice stock inventory as of July 1, 2016 was 2.73 million metric tons (Figure 1). This was 6.44 percent higher than the 2.57 million metric tons level in July 2015 but 15.51 percent lower than last month’s inventory level of 3.24 million metric tons (Table 1).
- Compared with last year, rice stocks in the households and in NFA depositories grew by 2.97 percent and 17.95 percent, respectively. However, stocks in commercial warehouses decreased by 0.23 percent (Table 1).
- This month’s rice stocks in all sectors were lower compared with their levels last month. Stocks in the households dropped by 16.05 percent, in commercial warehouses by 15.67 percent, and in NFA depositories by 14.76 percent (Table 1).
- Of this month’s total rice stock inventory, 35.90 percent were with the households, 30.68 percent in commercial warehouses, and 33.42 percent were in NFA depositories. The latter comprised 83.79 percent of imported rice.
- The total rice inventory for this month would be adequate for 81 days. Stocks in the households would be good for 29 days, those in NFA depositories for 27 days, and those in commercial warehouses for 25 days.
CORN
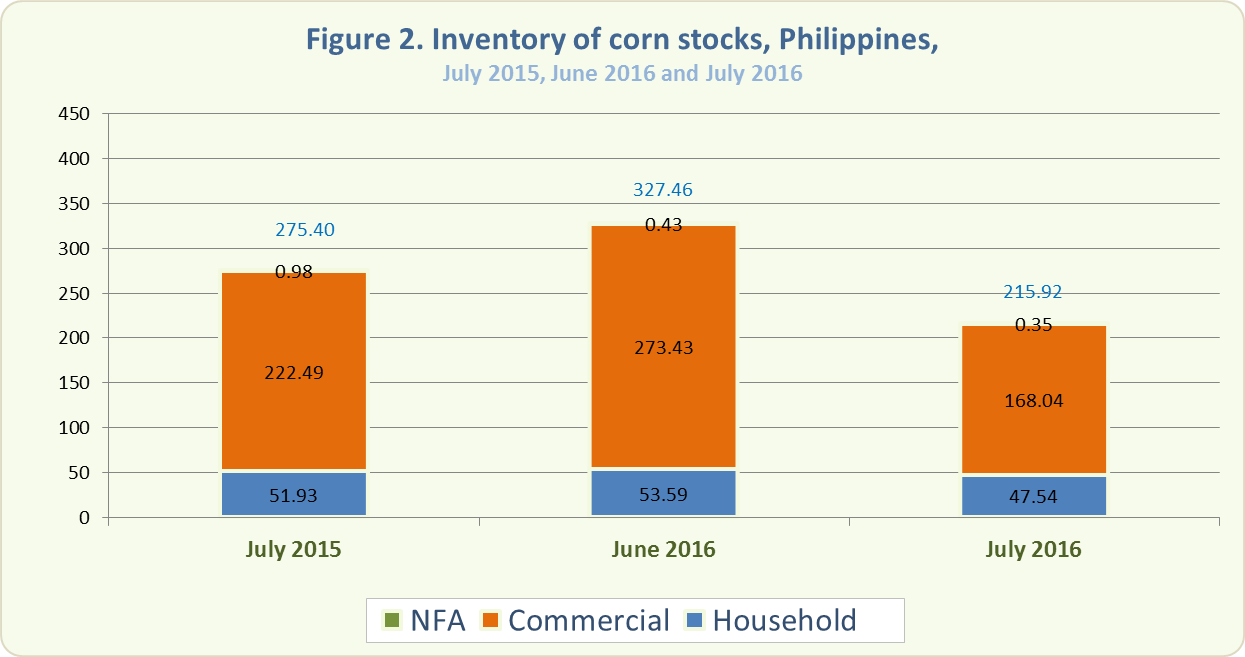
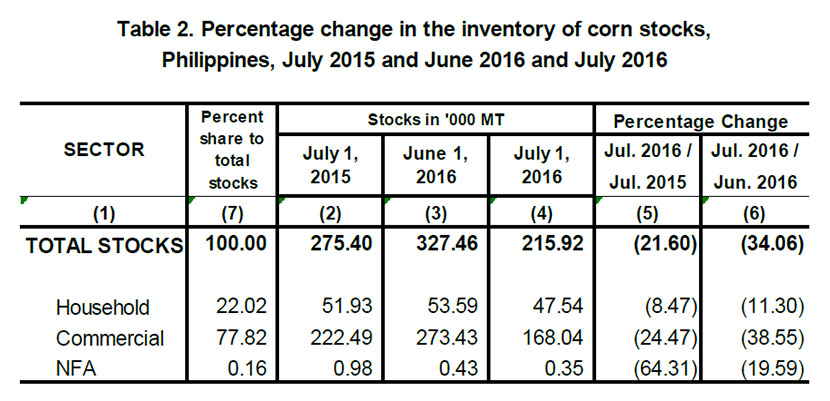
- As of July 1, 2016, the total corn stock inventory was 215.92 thousand metric tons (Figure 2). This was 21.60 percent lower than last year’s record of 275.40 thousand metric tons and 34.06 percent lower than last month’s level of 327.46 thousand metric tons (Table 2).
- Corn stocks in all sectors dropped compared with their levels last year. Stocks in the households decreased by 8.47 percent, in commercial warehouses by 24.47 percent, and in NFA depositories by 64.31 percent.
- This month’s corn stocks in all sectors decreased compared with their levels last month. Corn stocks in the households dropped by 11.30 percent, in commercial warehouses by 38.55 percent, and in NFA depositories by 19.59 percent.
- Around 77.82 percent of this month’s total corn stock inventory were in commercial warehouses, 22.02 percent were with the households, and 0.16 percent in NFA depositories.
Technical Notes
Monthly rice and corn stocks inventory are sourced out from three sectors, namely: household, commercial, and National Food Authority (NFA). The household stocks are taken from the Palay and Corn Stocks Survey (PCSS1) of the PSA, which covers farming and non-farming households nationwide. The commercial stocks are monitored by the NFA among their registered grains businessmen through the Commercial Stock Survey (CSS). NFA stocks are monitored from their warehouses/depositories.