
Rice and Corn Stocks Inventory, June 2024
RICE
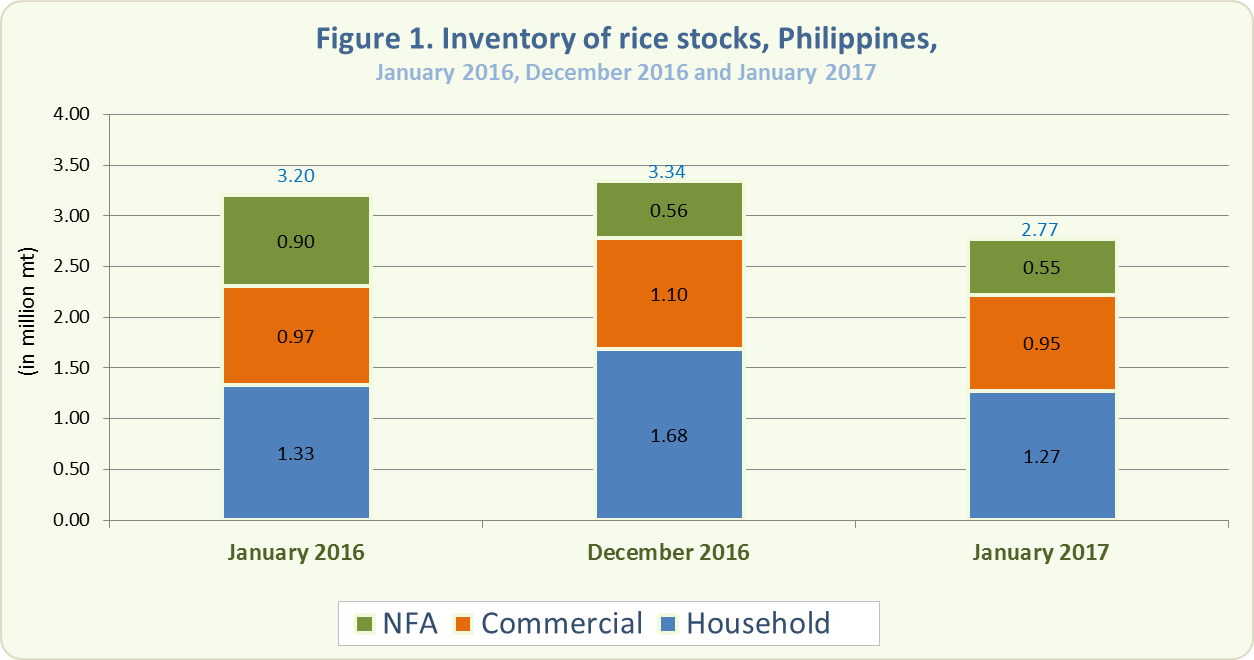
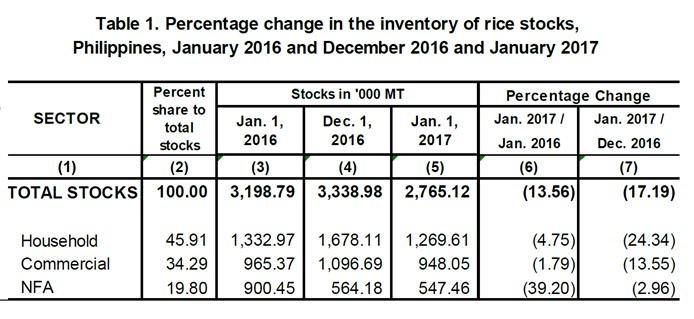
- The total rice stock inventory as of January 1, 2017 was 2.77 million metric tons (Figure 1). This was 13.56 percent lower than the 3.20 million metric tons level in January 2016 and 17.19 percent lower than the previous month’s inventory level of 3.34 million metric tons (Table 1).
- This month’s rice stocks in all sectors declined compared with their levels the previous year. Stocks in the households decreased by 4.75 percent, in commercial warehouses by 1.79 percent, and in NFA depositories by 39.20 percent (Table 1)
- Compared with their levels the previous month, stocks in all sectors dropped. Stocks in the households decreased by 24.34 percent, in commercial warehouses by 13.55 percent, and in NFA depositories by 2.96 percent (Table 1)
- Of this month’s total rice stock inventory, 45.91 percent were with the households, 34.29 percent were in commercial warehouses, and 19.80 percent were in NFA depositories. The latter comprised 79.52 percent of imported rice.
- The total rice inventory for this month would be sufficient for 81 days. Stocks in the households would be adequate for 37 days, those in commercial warehouses for 28 days, and those in NFA depositories for 16 days.
CORN
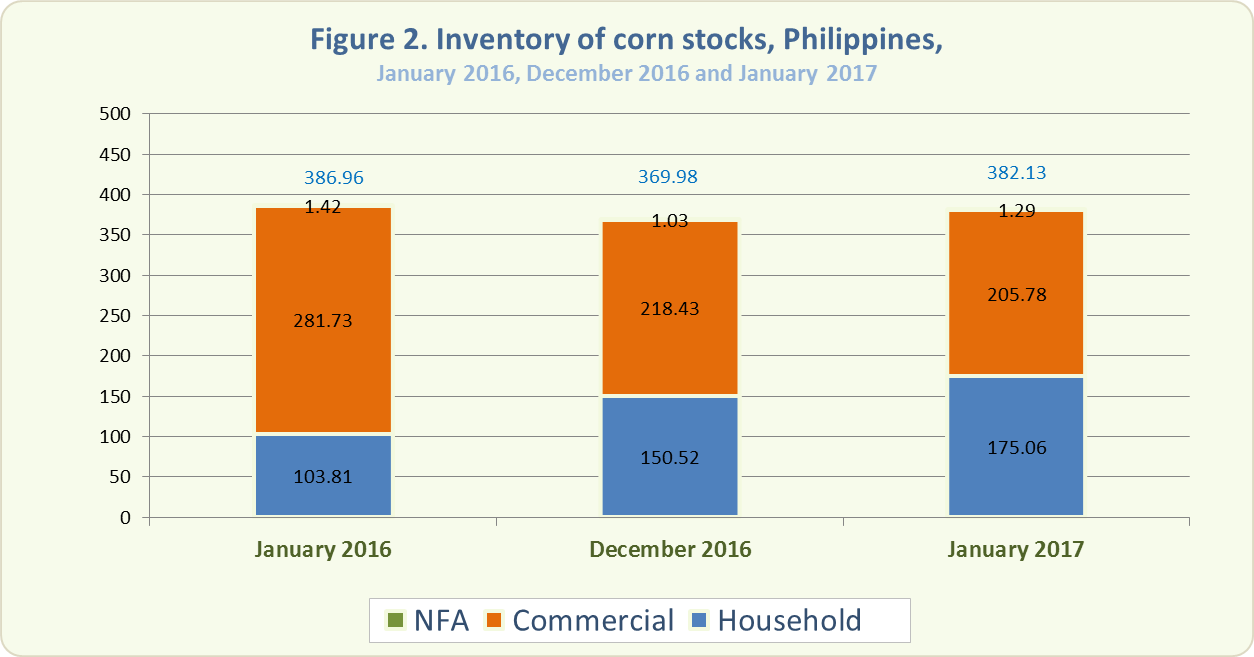
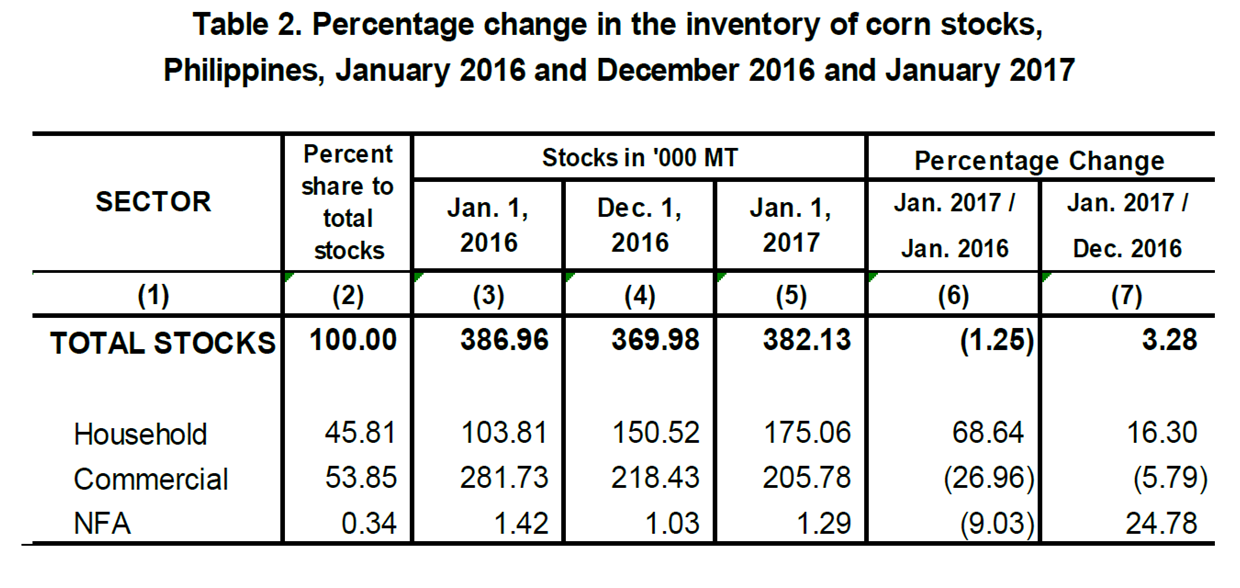
- As of January 1, 2017, the total corn stock inventory was 382.13 thousand metric tons (Figure 2). This was 1.25 percent lower than the previous year’s record of 386.96 thousand metric tons but 3.28 percent higher than the previous month’s level of 369.98 thousand metric tons (Table 2).
- Compared with the previous year, corn stocks in the households increased by 68.64 percent. On the other hand, stocks in commercial warehouses and NFA depositories decreased by 26.96 percent and 9.03 percent, respectively (Table 2).
- Month-on-month, corn stocks in the households and in NFA depositories grew by 16.30 percent and 24.78 percent, respectively. However, stocks in commercial warehouses dropped by 5.79 percent (Table 2).
- Around 53.85 percent of this month’s total corn stock inventory were in commercial warehouses, 45.81 percent were with the households, and 0.34 percent in NFA depositories.
Technical Notes
Monthly rice and corn stocks inventory are generated from three sectors, namely: household, commercial, and National Food Authority (NFA). The household stocks are taken from the Palay and Corn Stocks Survey (PCSS1) of the PSA, which covers farming and non-farming households nationwide. The commercial stocks are sourced from registered grains businessmen through the Commercial Stocks Survey (CSS), conducted by the NFA, the results of which are submitted to PSA. NFA stocks are monitored from their warehouses/depositories.