
Rice and Corn Stocks Inventory, June 2024
RICE
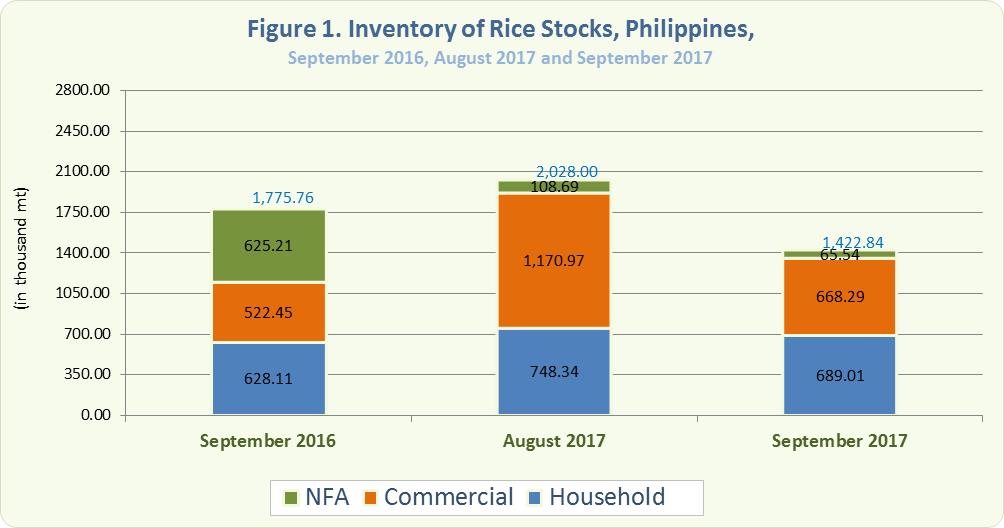
- The total rice stock inventory as of September 1, 2017 was 1,422.84 thousand metric tons (Figure 1). This was 19.87 percent below the 1,775.76 thousand metric tons level in September 2016 and 29.84 percent lower than the previous month’s inventory level of 2,028.00 thousand metric tons (Table 1).
- Compared with the previous year, rice stocks in households and in commercial warehouses grew by 9.70 and 27.92 percent, respectively. However, stocks in the NFA depositories dropped by 89.52 percent (Table 1).
- Compared with the previous month, stocks in the households, in commercial warehouses and in NFA depositories declined by 7.93 percent, 42.93 percent and 39.70 percent, respectively (Table 1).
- Of this month’s total rice stock inventory, 48.42 percent were with the households, 46.97 percent were in commercial warehouses, and 4.61 percent were in NFA depositories. The latter comprised 0.76 percent of imported rice.
- The total rice inventory for this month would be sufficient for 42 days. Stocks in the households would be enough for 20 days, those in commercial warehouses for 20 days, and those in NFA depositories for 2 days.
CORN
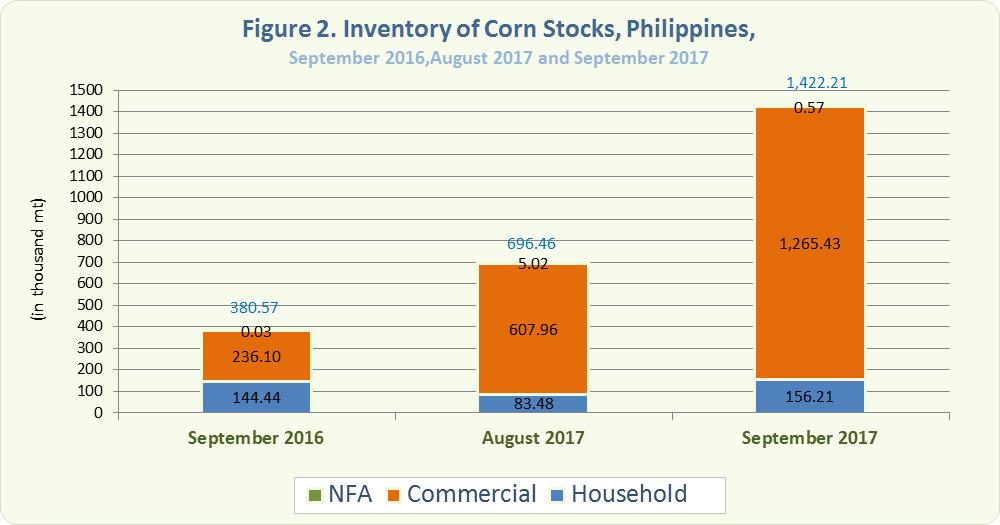
- As of September 1, 2017, the total corn stock inventory was 1,422.21 thousand metric tons (Figure 2). This was 273.71 percent higher than the previous year’s record of 380.57 thousand metric tons and 104.13 percent higher than the previous month’s level of 696.46 thousand metric tons (Table 2).
- Corn stocks in all sectors increased compared with their levels the previous year. Stocks in the households grew by 8.15 percent, in commercial warehouses by 435.97 percent, and in NFA depositories by 1,681.25 percent (Table 2).
- Month-on-month, corn stocks in the households and commercial warehouses increased by 87.13 percent and 108.14 percent, respectively. On the other hand, stocks in NFA depositories decreased by 88.65 percent (Table 2).
- Around 88.98 percent of this month’s total corn stock inventory were in commercial warehouses, 10.98 percent were with the households, and 0.04 percent in NFA depositories.
ROMEO S. RECIDE
Assistant Secretary
Deputy National Statistician
Sectoral Statistics Office
Technical Notes
Monthly rice and corn stocks inventory are generated from three sectors, namely: household, commercial, and National Food Authority (NFA). The household stocks are taken from the Palay and Corn Stocks Survey (PCSS1) of the PSA, which covers farming and non-farming households nationwide. The commercial stocks are sourced from registered grains businessmen through the Commercial Stocks Survey (CSS), conducted by the NFA, the results of which are submitted to PSA. NFA stocks are monitored from their warehouses/depositories.