
Table A. Summary of Construction Statistics from Approved Building Permits, Philippines | ||||||
|---|---|---|---|---|---|---|
Third Quarter 2021, Second Quarter 2022r and Third Quarter 2022p | ||||||
Type of Construction | Third Quarter 2021 | Second Quarter 2022r | Third Quarter 2022p | |||
| Level | Annual Growth Rate (percent) | Level | Annual Growth Rate (percent) | Level | Annual Growth Rate (percent) | |
| Total | ||||||
| Number | 37,704 | 8.7 | 41,514 | -2.0 | 40,384 | 7.1 |
| Floor Area (sq.m.) | 8,098,242 | 19.5 | 8,927,913 | 13.9 | 8,619,009 | 6.4 |
| Value (PhP '000) | 100,203,698.50 | 29.2 | 103,576,878.95 | 12.3 | 106,058,401.26 | 5.8 |
| Residential | ||||||
| Number | 26,754 | 7.8 | 29,615 | -1.7 | 29,208 | 9.2 |
| Floor Area (sq.m.) | 4,591,398 | 29.9 | 4,585,232 | 0.0 | 4,434,470 | -3.4 |
| Value (PhP '000) | 54,021,291.84 | 40.4 | 51,073,777.59 | 7.3 | 48,088,079.81 | -11.0 |
| Non-residential | ||||||
| Number | 6,343 | 21.1 | 7,026 | 11.8 | 7,287 | 14.9 |
| Floor Area (sq.m.) | 3,421,201 | 7.6 | 4,220,384 | 33.5 | 4,064,437 | 18.8 |
| Value (PhP '000) | 35,199,660.88 | 5.3 | 45,702,583.45 | 26.2 | 49,212,265.03 | 39.8 |
| Addition | ||||||
| Number | 1,020 | 9.3 | 1,346 | 8.3 | 1,227 | 20.3 |
| Floor Area (sq.m.) | 85,643 | 35.2 | 122,297 | 30.8 | 120,102 | 40.2 |
| Value (PhP '000) | 776,802.88 | 46.3 | 1,194,326.54 | 31.0 | 1,084,587.21 | 39.6 |
| Alteration and Repair | ||||||
| Number | 3,587 | -2.8 | 3,527 | -24.8 | 2,662 | -25.8 |
| Value (PhP '000) | 10,205,942.90 | 98.3 | 5,606,191.37 | -25.6 | 7,673,469.21 | -24.8 |
PhP ‘000 – in thousand pesos
p – preliminary
r – revised
Note: Details of floor area and value may not add up to their respective totals due to rounding.
Source: Philippine Statistics Authority
Number of Constructions
- Number of constructions increased
The total number of constructions from approved building permits reached 40,384 in the third quarter of 2022. This indicates an annual increase of 7.1 percent from the 37,704 total number of constructions in the same quarter of the previous year. In the third quarter of 2021, the number of constructions increased by 8.7 percent annually. (Tables A and 1)
Residential buildings still reported the highest number of constructions
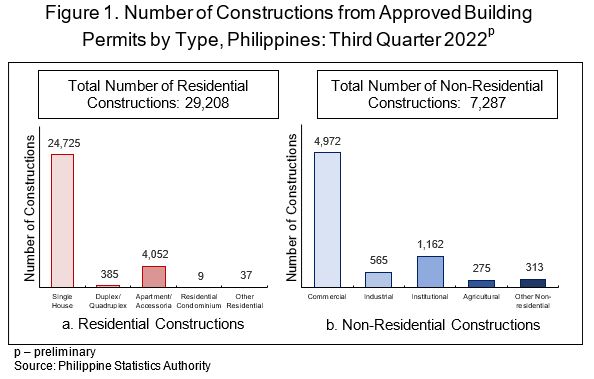
By type of construction, residential buildings reported the highest number of constructions during the quarter, which totaled to 29,208 or 72.3 percent of the total number of constructions during the quarter. This type of construction expanded at an annual rate of 9.2 percent compared with the 26,754 constructions in the same quarter of the previous year. Majority of the total residential constructions were single-type houses with 24,725 (84.7%). (Figure 1a, and Tables A and 1)
Meanwhile, the non-residential type of construction was the second highest in terms of number of constructions at 7,287 or 18.0 percent of the total number of constructions in the third quarter of 2022. This type of construction increased in number during the period at an annual rate of 14.9 percent. Most of the non-residential constructions were commercial buildings with 4,972 (68.2%). (Figure 1b, and Tables A and 1)
Addition, which refers to any new construction that increases the height or area of an existing building/structure, and alteration and repair of existing structures, contributed 3.0 percent and 6.6 percent to the total number of constructions, respectively. Compared with their respective levels in the same period of the previous year, addition-type of construction expanded at an annual rate of 20.3 percent this quarter, while alteration and repair dropped at an annual rate of -25.8 percent. (Tables A and 1)
Number of constructions was highest in CALABARZON
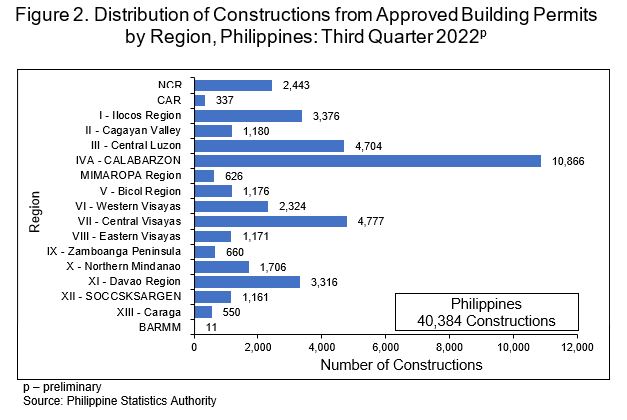
CALABARZON continued to register the highest number of constructions with 10,866 constructions or 26.9 percent share to the total number of constructions during the quarter. Completing the top three regions with the highest number of constructions were Central Visayas with 4,777 constructions (11.8%) and Central Luzon with 4,704 constructions (11.6%). (Figure 2 and Table 2)
Value of Constructions
- Total value of constructions increased
In the third quarter of 2022, the total value of constructions amounted to PhP 106.06 billion, which indicates an annual increase of 5.8 percent from the PhP 100.20 billion value of constructions posted in the same quarter of 2021. (Tables A and 1)
Non-residential-type recorded the highest value of constructions
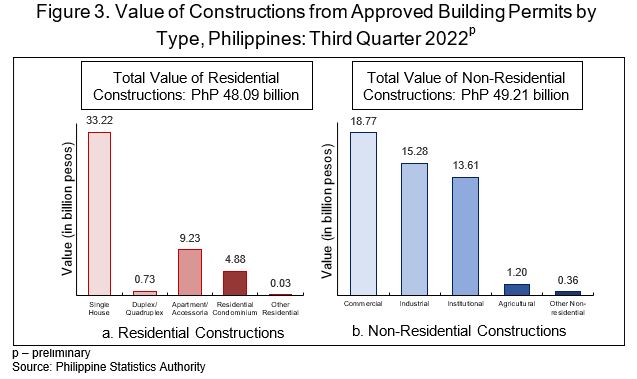
The non-residential building constructions valued at PhP 49.21 billion, accounted for 46.4 percent of the total value of constructions during the quarter. This indicates an expansion of 39.8 percent from the PhP 35.20 billion total construction value in the same quarter of 2021. Among non-residential constructions, commercial buildings had the highest value of constructions at PhP 18.77 billion (38.1%).(Figure 3b, and Tables A and 1)
In contrast, the construction value of residential buildings amounted to PhP 48.09 billion or 45.3 percent of the total construction value during the quarter. This reflects an annual decline of -11.0 percent from the PhP 54.02 billion value of residential constructions in the same quarter of the previous year. Among residential constructions, single-type houses registered the highest value of constructions at PhP 33.22 billion (69.1%). (Figure 3a, and Tables A and 1)
For this quarter, the value of construction for addition to, and alteration and repair of existing structures amounted to PhP 1.08 billion (1.0%) and PhP 7.67 billion (7.2%), respectively. The value of construction for addition-type expanded at an annual rate of 39.6 percent, while the construction value for alteration and repair of existing structure declined at an annual rate of -24.8 percent. (Tables A and 1)
Top three regions contributed more than half to the total value of constructions
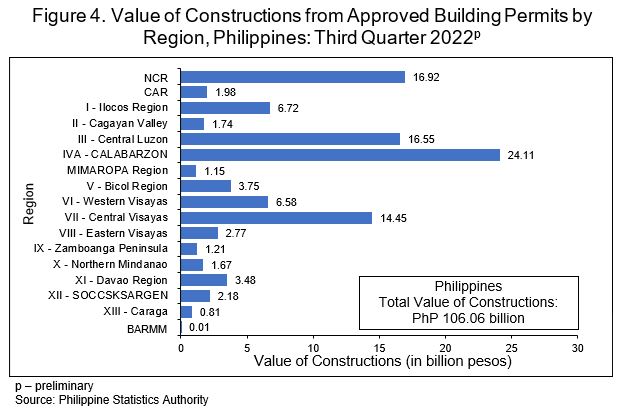
The combined shares of the top three regions in terms of value of constructions amounted to PhP 57.58 billion or 54.3 percent of the total. These regions were:
CALABARZON, PhP 24.11 billion (22.7%);
National Capital Region, PhP 16.92 billion (16.0%); and
- Central Luzon, PhP 16.55 billion (15.6%).
Floor Area
- Reported total floor area of constructions increased
The reported total floor area of constructions for this quarter was registered at 8.62 million square meters. This translates to a slower annual increase of 6.4 percent from 13.9 percent annual increment in the previous quarter. On the other hand, it expanded at an annual rate of 19.5 percent in the third quarter of 2021. (Tables A and 1)
Residential-type accounted for more than half of the total floor area of constructions
Residential constructions recorded 4.43 million square meters or 51.4 percent of the total floor area of constructions this quarter. It contracted at an annual rate of -3.4 percent compared with the previous year’s same quarter floor area of 4.59 million square meters.
On the other hand, non-residential constructions recorded 4.06 million square meters or 47.2 percent of the total floor area of constructions this quarter. This reflects an annual increment of 18.8 percent compared with its floor area of 3.42 million square meters in the same quarter of the previous year. (Tables A and 1)
Average Cost per Square Meter
- Average cost of construction expanded
The average cost of constructions in the third quarter of 2022, excluding those for alteration and repair, and other non-residential, was recorded at PhP 11,373.37 per square meter. It expanded at an annual rate of 3.4 percent compared with the average cost of PhP 11,000.92 per square meter in the third quarter of 2021. (Table 1)
Non-residential buildings had the highest average cost of constructions
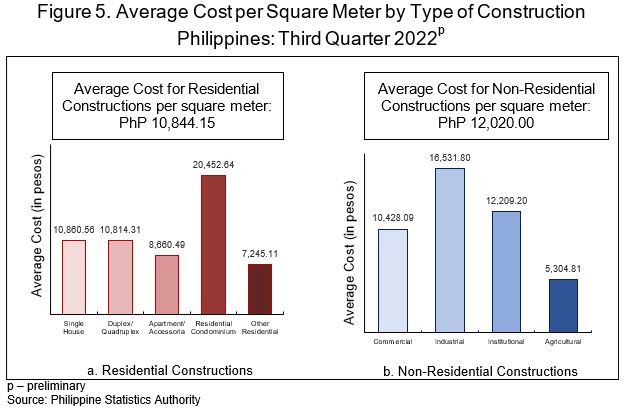
Among types of construction, non-residential buildings registered the highest average cost of PhP 12,020.00 per square meter during the quarter. This was followed by residential with PhP 10,844.15 per square meter, and addition to existing structures with PhP 9,030.55 per square meter. (Table 1)
Residential condominium constructions were the most expensive among types of residential constructions
Among residential constructions, residential condominiums posted the highest average cost of PhP 20,452.64 per square meter during the quarter. Meanwhile, the lowest average cost per square meter of PhP 7,245.11 was recorded in other types of residential constructions not elsewhere classified. (Figure 5a and Table 1)
Industrial-type buildings had the highest cost among non-residential constructions
Among non-residential constructions, industrial-type buildings reported the highest average cost of PhP 16,531.80 per square meter for this quarter. On the other hand, agricultural-type buildings continued to register the lowest average cost of PhP 5,304.81 per square meter. (Figure 5b and Table 1)
DIVINA GRACIA L. DEL PRADO, PhD
Assistant Secretary
Deputy National Statistician
Sectoral Statistics Office
TECHNICAL NOTES
Construction Statistics from Approved Building Permits
I. Introduction
I.1. Introduction
The Philippine Statistics Authority (PSA) serves as the central statistical authority of the government on primary data collection which includes the consolidation of selected administrative recording systems. Construction statistics from approved building permits is one of the data generated by PSA based on administrative records. It is compiled by PSA from the copies of approved building permits issued by the Local Building Officials (LBOs) of the Local Government Units (LGUs).
However, the approved building permits issued by LBOs is just one of the sources of construction statistics. Other sources of construction statistics are the surveys of construction establishments and enterprises conducted by the PSA, and the administrative-based data from the Department of Public Works and Highways (DPWH) and the Commission on Audit.
This Special Release presents the preliminary data on construction statistics from approved building permits for the third quarter of 2022. Data are presented at the regional, provincial and/or Highly Urbanized City (HUC) levels with monthly and quarterly disaggregation.
I.2. Objectives
Construction statistics from approved building permits aim to provide monthly administrative-based data on building constructions at the municipality level nationwide. Statistics generated are the following:
1. number of units/buildings
2. floor area of the buildings
3. types of construction
4. value of construction
I.3. Historical Background
The collection of approved building permit forms started in 1977 when the then National Census and Statistics Office (NCSO) (now part of the PSA) and the Ministry of Local Government and Community Development entered into an informal agreement in 1976 to implement the provisions of the National Building Code (NBC) and to monitor the building permit forms.
Later, on 11 July 1979, a Memorandum of Agreement (MOA) between the NCSO and the former Ministry of Public Works, Transportation and Communication (MPWTC) (now the DPWH) defined the agencies’ responsibilities in the generation of construction statistics. The NCSO was responsible for the collection, processing, analysis, and dissemination of construction statistics, while MPWTC shouldered the printing of the building permit forms from 1980 onwards.
In 1993, a joint Memorandum Circular was issued by the Department of Interior and Local Government and the DPWH defining the duties and responsibilities of the municipal/city engineers relative to the implementation of the NBC and in the production of construction statistics from approved building permits. As a result, the printing of the building permits and certificate of completion forms became the responsibility of the LBOs.
On 15 July 2005, the DPWH through the National Building Code Development Office (NBCDO) issued Memorandum Circular No. 01 series of 2005 instructing all LBOs to implement the revised Implementing Rules and Regulations (IRR) including the use of the new building permit form.
The building permit form under the old IRR is valid for use by LGUs until today.
I.4. Scope and Coverage
Construction statistics presented in this special release are based on the approved building permits on new constructions, additions, and alterations and repairs of existing residential and non-residential buildings, and other structures, which are proposed to be constructed in different cities/municipalities of the country.
I.5. Geographic Classification
For the third quarter of 2022, building constructions are classified and presented by geographic area using the Philippine Standard Geographic Classification (PSGC) as of December 2021.
II. Data Collection
II.1. Data Collection
The collection of the approved building permits from the LBOs is done within the first five working days after each reference month by a PSA field staff.
II.2. Sources of Data
Construction statistics are compiled by the PSA from the copies of original application forms of approved building permits as well as from the demolition and fencing permits collected every month by PSA field personnel from the offices of LBOs nationwide.
II.3. Statistics Generated
Construction statistics generated from approved building permits provide monthly data on building construction at the regional and provincial levels. The statistics generated are the following:
1. number of constructions
2. floor area
3. type of construction
4. value of construction
Aside from the preliminary tables posted in the PSA website, the annual, quarterly, and monthly statistical tables at the municipality level by type of construction are available in OpenStat.
II.4. Limitations of Data
Data on building constructions are based on approved applications for construction during the reference period and not on the construction work completed during the reference period.
The completeness of construction data relies on the approved applications filed in the LBOs. Hence, building constructions without approved building permits are not part of the tabulation of data.
III. Concepts and Definitions of Terms
The definition of terms is adopted from the Revised and Updated IRR of the National Building Code.
Building permit is a written authorization granted by the LBO to an applicant allowing him to proceed with the construction of a specific project after plans, specifications, and other pertinent documents have been found to be in conformity with the National Building Code (PD 1096).
Building refers to any independent, free-standing structure comprised of one or more rooms or other spaces, covered by a roof and enclosed with external walls or dividing walls, which extend from the foundation to the roof.
Construction refers to all on-site work done from site preparation, excavation, foundation, assembly of all the components and installation of utilities, machineries, and equipment of buildings/structures.
Residential building is a building for which its major parts or more than half of its gross floor area is built for dwelling purposes. This type of building can be of the single type, duplex, apartment and/or accessoria, and residential condominium.
Single house is a complete structure intended for a single family or household, i.e., bungalow, 2-storey house, nipa hut, etc.
Duplex house is a structure intended for two households, with complete living facilities for each; it is a single structure divided into two dwelling units by a wall extending from the floor to the ceiling.
Apartment is a structure, usually of two storeys, made up of independent living quarters, with independent entrances from internal walls and courts.
Accesoria is a one or two-floor structure divided into several dwelling units, each dwelling unit having its own separate entrance from the outside.
Residential condominium is a structure, usually of several storeys, consisting of multiple dwelling units.
Other residential construction consists of school or company staff houses, living quarters for drivers and maids, and guardhouses.
Non-residential building includes commercial, industrial, agricultural, and institutional buildings.
Commercial buildings refer to office buildings and all buildings which are intended for use primarily in wholesale, retail, and service trades; i.e., stores, hotels, restaurants, banks, disco houses, etc.
Industrial buildings are buildings used to house the production, assembly, and warehousing activities of industrial establishments; i.e., factories, plants, mills, repair shops, machine shops, printing press, storage plants, electric generating plants.
Institutional buildings are buildings which primarily engaged in providing educational instructions and hospital/health care; ports, airports and other government buildings; i.e., schools, museums, libraries, sanitaria, churches, hospitals.
Agricultural buildings are buildings used to house livestock, plants, and agricultural products such as barns, poultry houses, piggeries, stables, greenhouses, and grain mills.
Other non-building constructions include cemetery structures, street furniture, waiting sheds, communication towers, etc.
Addition refers to any new construction which increases the height or area of an existing building/structure.
Repair is a remedial work done on any damaged or deteriorated portion/s of a building/structure to restore its original condition.
Renovation is any physical change made on structures to increase their value and quality.
Alteration is a construction in a building/structure involving changes in the materials used, partitioning and location/size of openings, structural parts, existing utilities, and equipment but does not increase the overall area thereof.
Conversion is a change in the use or occupancy of structure or any portion thereof, which has different requirements.
Demolitions refer to the systematic dismantling or destruction of a building/structure, in whole or in part.
Street furniture are street structures consisting of monuments, waiting sheds, benches, plant boxes, lampposts, electric poles, and telephone poles.
Floor area of building refers to the sum of the area of each floor of the building measured to the outer surface of the outer walls including the area of lobbies, cellars, elevator shafts, and all communal spaces in multi-dwellings. Areas of balconies are excluded.
Total value of construction refers to the sum of the cost of building, electrical, mechanical, plumbing, and others. The value is derived from the approved building permit and represents the estimated value of the building or structure when completed.
IV. Dissemination of Results and Revision
V.1 Dissemination
Preliminary results of construction statistics are made public in the form of Quarterly Special Releases. The Quarterly Special Releases are reports containing the preliminary results of construction statistics submitted within the cut-off dates for each month. Results are posted 50 days after the reference quarter in the PSA website. The statistical tables are also available in OpenStat.
V.2 Revision
All documents received after the cut-off date, which is 40 days after the reference quarter, are included in the generation of revised results. The revised data of the previous quarter are reported during the release of the preliminary report of the current quarter. Revisions are made for the previous quarters until the annual report is released seven months after the reference year.
V. Citation
Philippine Statistics Authority. (July 2023). Technical Notes on the Construction Statistics from Approved Building Permits. https://psa.gov.ph/technical-notes/buildingpermit
VI. Contact Information
John Paul C. Sacop
(Supervising Statistical Specialist)
Officer-in-Charge
Industry Statistics Division
(632) 8376-2060
non-mfg.staff@psa.gov.ph
isd.staff@psa.gov.ph
For data request, you may contact the:
Knowledge Management and Communications Division
(632) 8462-6600 local 839
info@psa.gov.ph