
|
|||||||||||||||||||||||||||||||||||||||||||||||
|
|
|||
|
Top 10 Philippine Imports from All Countries: January 2005 |
|||
|
Gainers |
Losers |
||
|
Metalliferous Ores and Metal Scrap |
452.8 |
Telecommunication Equipment and Electrical Machinery |
-7.4 |
|
Organic and Inorganic Chemical |
26.2 |
Industrial Machinery and Equipment |
-7.2 |
|
Mineral Fuels, Lubricants and Related Materials |
9.0 |
Electronic Products |
-6.8 |
|
Textile Yarn, Fabrics, Made-up Articles and Related Products |
4.1 |
Plastics in Primary and Non-Primary Forms |
-6.3 |
|
Iron and Steel |
1.6 |
Transport Equipment |
-5.8 |
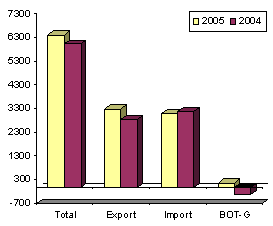
January total trade stands at $6.394 billion
Total external trade in goods for January 2005 amounted to $6.394 billion representing an increment of 6.1 percent from $6.023 billion during the same period of the previous yearr. On the other hand, exports registered a year-on-year growtht of 15.4 percent to aggregate dollar revenue of $3.282 billion from $2.844 billion a year ago. Balance of trade in goods (BOT-G) surplus for the Philippines reached $170 million,a reversal compared to last year’s deficit of $336 million.
Figure 1. Philippine Trade Performance in January :2004 and 2005
(F.O.B. Value in Million US Dollar)
January imports register 2.1 percent decrease
Total foreign-made merchandise declined by 2.1 percent to $3.112 billion from $3.179 billion. Compared to last month, total merchandise trade for January 2005 gained by 1.3 percent to $6.394 billion from $6.313 billion in December 2004. Dollar-inflow generated by exports amounted to $3.282 billion, or 0.4 percent higher than last month’s $3.268 billion, while expenditures for imported goods rose by 2.2 percent to $3.112 billion from $3.045 billion.
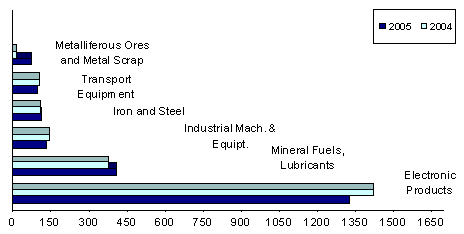
Electronic products account for 42.6 percent of import bill
Accounting for 42.6 percent of the total aggregate import bill, payments for electronic products amounted to $1.325 billion or a 6.8 percent drop over last year’s figure of $1.421 billion. Compared to the previous month’s level, purchases grew by 6.8 percent from $1.240 billion.
Imports of mineral fuels, lubricants and related materials in January ranked second with 13.2 percent share. Expenditures at $409.70 million, posted a 9.0 percent growth over the previous year’s level of $375.96 million.
Industrial machinery and equipment, the third top import was worth $134.94 million, or a reduction of 7.2 percent from $145.45 million a year earlier.
Iron and steel, accounting for 3.6 percent of the total imports, ranked fourth as foreign bill amounted to $113.32 million, a slight incease of 1.6 percent from $111.54 million last year.
Transport equipment, contributing 3.1 percent to the total bill, was RP’s fifth top import for the month with payments placed at $96.49 million or a decline of 5.8 percent from last year’s $102.40 million.
Expenditures for metalliferous ores and metal scrap, with a 2.4 percent share to the aggregate bill, went up by as much as 452.84 percent to $74.12 million from $13.41 million in January 2004.
Rounding up the list of the top imports for January 2005 were textile yarn, fabrics, made-up articles and related products , $72.68 million; organic and inorganic chemical, $67.25 million; telecommunication equipment and electrical machinery, $63.57 million; and plastics in primary and non-primary forms, $61.47 million.
Aggregate payment for the country’s top ten imports for January 2005 reached to $2.418 billion or 77.7 percent of the total bill.
Figure 2. Philippine Top Imports in January 2004 and 2005
(F.O.B. Value in Million US Dollar)
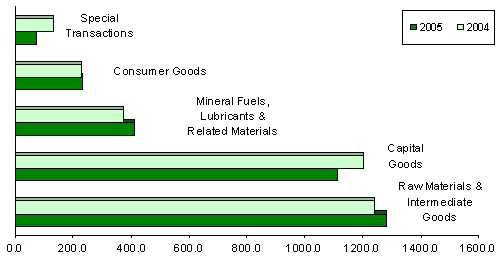
Raw materials and intermediate goods account for 41.2 percent of the total imports
Payments in January for raw materials and intermediate goods accounted for 41.2 percent as importation advanced by 3.4 percent to $1.283 billion from last year’s figure of $1.241 billion. Semi-processed raw materials got the biggest share with a 35.8 percent and valued at $1.113 billion.
Capital goods comprising 35.8 percent of the total imports dropped by 7.4 percent year-on-year to $1.113 billion from $1.202 billion. The principal share went to telecommunication equipment and electrical machinery with a 20.5 percent share of the total imports and billed at $637.45 million.
Expenditures for mineral fuels, lubricants and related materials accelerated by 9.0 percent to $409.70 million from $375.96 million during the same period of 2004.
Purchases of consumer goods, amounted to $232.55 million, an increase of 2.2 percent from $227.57 million in January 2004, while special transactions decreased by 45.0 percent to $73.42 million from $133.58 million.
Figure 3. Philippine Imports by Major Type of Goods in January: 2004 and 2005
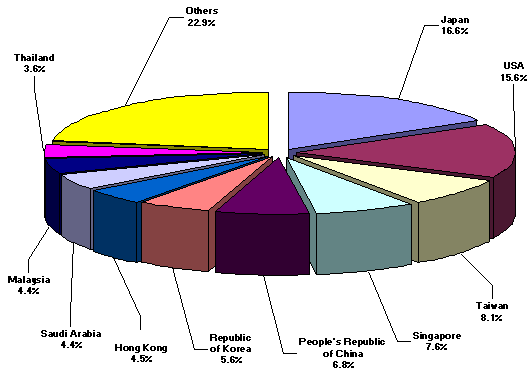
Japan corners 16.6 percent of january import bill
Imports from Japan accounting for 16.6 percent of the total import bill, went down by 10.7 percent to $515.13 million from $576.85 million during the same period of 2004. On the contrary, exports to Japan rose by 37.1 percent, amounting to $685.73 million yielding a two-way trade value of $1.201 billion and a trade surplus for RP placed at $170.59 million.
United States, the country’s second biggest source of imports for January with a 15.6 percent share, reported shipments billed at $485.75 million against exports earnings of $627.13 million. Total trade amounted to $1.113 billion, with a trade surplus registered at $141.38 million.
Taiwan followed as the third biggest source of imports. With payments worth $251.61 million, imports grew by 49.3 percent from $168.54 million, while revenue from RP’s exports reached $161.73 million resulting to a total trade value of $413.35 million and an $89.88 million deficit for Philippines.
Other major sources of imports for the month of January were Singapore, $236.58 million; People’s Republic of China, $211.12 million; Republic of Korea, $173.42 million; Hong Kong, $141.42 million; Saudi Arabia, $137.63 million; Malaysia, $136.78 million; and Thailand, $111.11 million.
Payments for imports from the top ten sources for the month amounted to $2.401 billion or 77.1 percent of the total.
Figure 4. Philippine Imports by Country in January: 2005
As of press time 16 out of 54,429 export documents and 43 out of 68,996 import documents are still expected from the ports.
|
(Sgd.) CARMELITA N. ERICTA |
Source: National Statistics Office
Manila, Philippines
| Attachment | Size |
|---|---|
|
|
5.79 KB |
|
|
5.32 KB |
|
|
9.43 KB |
|
|
12.66 KB |
|
|
5.67 KB |
|
|
6.56 KB |