
EXTERNAL TRADE PERFORMANCE
March 2011
(Preliminary)
p - preliminary
r - revised

JANUARY TO MARCH 2011 TOTAL TRADE STANDS AT $27.805 BILLION
Total external trade in goods for the first quarter of 2011 (January to March) reached $27.805 billion, a 15.4 percent increment from $24.104 billion registered during the same period in 2010. Total imports posted a 22.0 percent annual increase to $15.586 billion from $12.772 billion. Similarly, total exports were up by 7.8 percent to $12.219 billion in January to March of 2011 from $11.331 billion in 2010. Thus, the balance of trade in goods (BOT-G) for the Philippines posted a deficit of $3.368 billion during the 3-month period in 2011, a value higher than the $1.441 billion deficit in the same 3-month period last year.
Figure 2A Philippine Trade Performance in January - March : 2011 and 2010
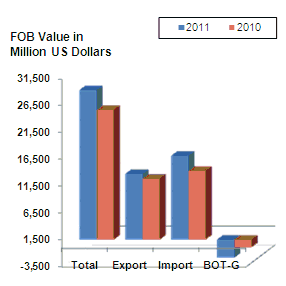
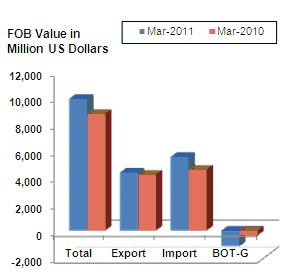
Figure 2B Philippine Trade Performance in March : 2011 and 2010
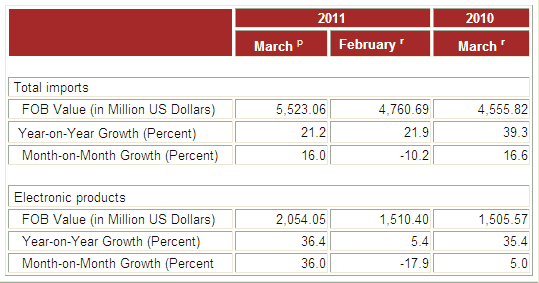
MARCH 2011 IMPORTS UP BY 21.2 PERCENT
The country’s total merchandise imports for March 2011 rose by 21.2 percent to $5.523 billion from $4.556 billion in 2010. Similarly, month-on-month, it increased by 16.0 percent from $4.761 billion recorded in February 2011. Total trade for March 2011 was registered at $9.876 billion, higher by 13.0 percent from $8.738 billion in March 2010. Thus, the balance of trade in goods (BOT-G) in March 2011 posted a deficit of $1.170 billion compared to last year’s recorded deficit value of $374.00 million.
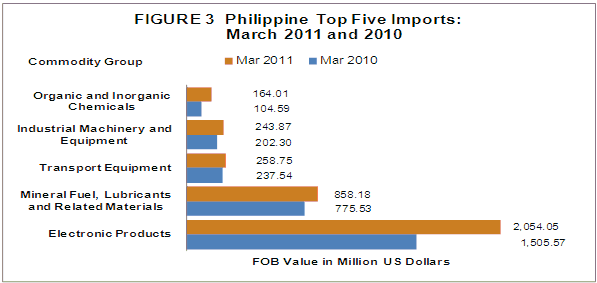
ELECTRONIC PRODUCTS ACCOUNT FOR 37.2 PERCENT OF IMPORT BILL
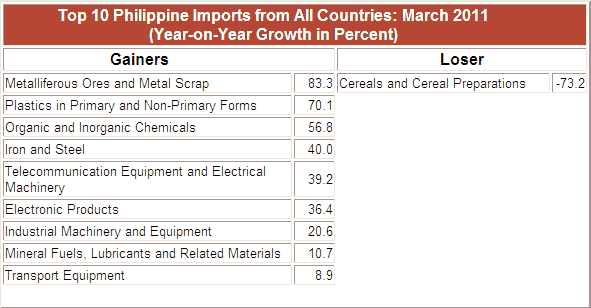
Accounting for 37.2 percent of the aggregate import bill, payments for Electronic Products (including consigned and direct importation using the expanded coverage of electronic products) in March 2011 amounted to $2.054 billion. It went up by 36.4 percent over last year's figure of $1.506 billion. On a monthly basis, it expanded by 36.0 percent from $1.510 billion recorded in February 2011. Among the major groups of electronic products, Components/Devices (Semiconductors) having the biggest share of 31.8 percent, accelerated by 53.6 percent to $1.755 billion from $1.142 billion last year.
Imports of Mineral Fuels, Lubricants and Related Materials in March 2011 ranked second with 15.5 percent share to $858.18 million over the previous year’s level of $775.53 million.
Transport Equipment registered as the country’s third top import for the month with 4.7 percent share to total imports valued at $258.75 million. The value expanded by 8.9 percent from previous year level of $237.54 million.
Industrial Machinery and Equipment, contributing 4.4 percent to the total import bill was the PH’s fourth top import for the month with payments placed at $243.87 million, an increase of 20.6 percent from last year’s $202.30 million.
Fifth in rank and with a 3.0 percent share to the total imports, Organic and Inorganic Chemicals recorded $164.01 million, higher by 56.8 percent from its year ago level of $104.59 million.
Plastics in Primary and Non-Primary Forms ranked sixth, comprising 2.6 percent of the total imports registered $142.72 million worth of imports and posted the highest positive annual growth among the top ten imports in March 2011 at 70.1 percent from March 2010 level of $83.89 million.
Rounding up the list of the top ten imports for 2011 were Iron and Steel valued at $124.39 million (2.3%); Cereals and Cereal Preparations amounting to $115.06 million (2.1%); Metalliferous Ores and Metal Scrap, $111.05 million (2.0%); and Telecommunication Equipment and Electrical Machinery including telecommunications and sound recording and reproducing apparatus and equipment, $100.98 million (1.8%).
Aggregate payment for the country’s top ten imports for 2011 reached $4.173 billion or 75.6 percent of the total import bill.
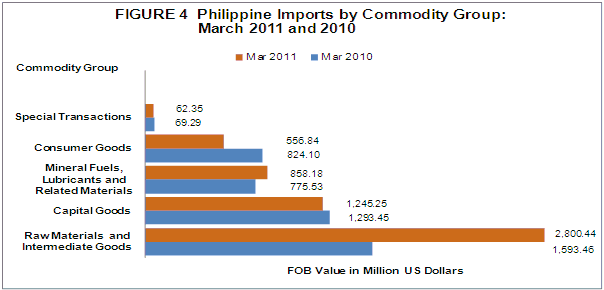
RAW MATERIALS AND INTERMEDIATE GOODS ACCOUNT FOR 50.7 PERCENT OF THE TOTAL IMPORTS
Accounting for 50.7 percent of the total imports, payments in March 2011 for Raw Materials and Intermediate Goods amounted to $2.800 billion or a 75.7 percent increment over last year's figure of $1.593 billion. Compared to the previous month’s level, purchases climbed to 31.4 percent from $2.130 billion. Semi-Processed Raw Materials had the biggest share of 45.3 percent and valued at $2.504 billion grew by 75.7 percent from $1.425 billion.
Capital Goods, which comprised 22.5 percent of the total imports, declined by 3.7 percent from $1.293 billion in March 2010 to $1.245 billion.
Mineral Fuels, Lubricants and Related Materials with 15.5 percent share, increased by 10.7 percent to $858.18 million from $775.53 million in March 2010.
Purchases of Consumer Goods amounted to $556.84 million or a decrease of 32.4 percent from $824.10 million in 2010. Likewise, Special Transactions fell by 10.0 percent from $69.29 million in March 2010 to $62.35 million in March 2011.
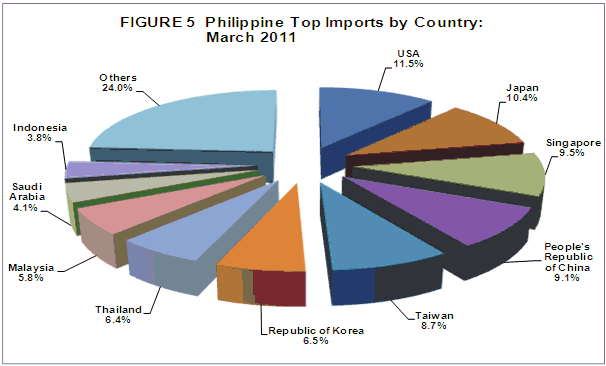
IMPORTS FROM THE USA ACCOUNTS FOR 11.5 PERCENT
Comprising 11.5 percent share of the total import bill, United States of America (USA) including Alaska and Hawaii was reported as the country’s biggest source of imports for March 2011 with $636.48 million, an increase of 40.5 percent from $453.04 million in March 2010. Exports to USA amounted to $608.75 million, yielding a two-way trade value of $1.245 billion and a trade deficit for PH of $27.73 million.
Japan including Okinawa was the second biggest source of imports with 10.4 percent share and recorded payments worth $576.83 million. This number represents a 3.7 percent drop from $598.85 million in March 2010. Revenue from PH’s exports to Japan, on the other hand, reached $760.70 million, generating a total trade value of $1.338 billion and $183.87 million trade surplus for the Philippines.
Singapore came third, Singapore amounted to $412.26 million resulting to a total trade value of $936.56 million and a trade deficit of $112.05 million.
People’s Republic of China settled fourth, accounting for 9.1 percent share of the total import bill in March 2011 and a 62.6 percent annual increment to $503.66 million from $309.84 million in March 2010. Exports to People’s Republic of China amounted to $500.34 million resulting to a total trade value of $1.004 billion and a trade deficit of $3.33 million.
Fifth in rank was Taiwan, representing 8.7 percent of the total import bill in March 2011 amounting to $481.36 million. Meanwhile, export receipts from Taiwan reached $178.29 million yielding a total trade value of $659.64 million and a trade deficit of $303.07 million.
Other major sources of imports for March 2011 were Republic of Korea, $360.40 million (6.5%); Thailand, $355.47 million (6.4%); Malaysia including Sabah and Sarawak, $322.46 million (5.8%); Saudi Arabia, $225.89 million (4.1%); and Indonesia, $210.38 million (3.8%).
Payments for imports from the top ten sources for March 2011 amounted to $4.197 billion or 76.0 percent of the total.
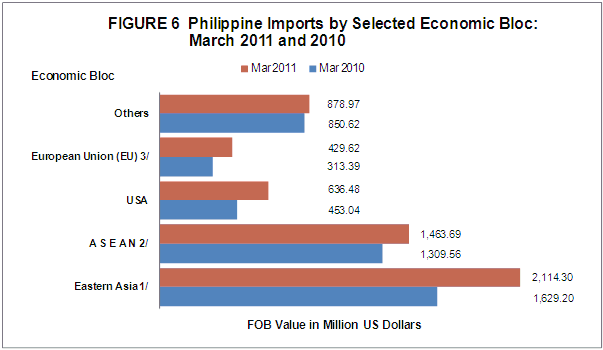
IMPORTS FROM EASTERN
Total imports of the Philippines from Eastern Asia (China, Hong Kong, Japan, Macau, Mongolia, North Korea, South Korea and Taiwan) accounted for 38.3 percent with payments posted at $2.114 billion or a 29.8 percent increment from March 2010 level of $1.629 billion. Total exports to member-countries of Eastern Asia on the other hand, were valued at $2.108 billion, resulting to a total trade of $4.222 billion and a balance of trade in goods (BOT-G) deficit of $6.76 million.
Philippine imports from ASEAN member-countries representing 26.5 percent share in March 2011 amounted to $1.464 billion, up by 11.8 percent from $1.310 billion registered in March 2010. Meanwhile, exports to ASEAN member-countries were worth $813.61 million, resulting to a total trade of $2.277 billion and a trade deficit of $650.09 million.
Total imports from European Union were valued at $429.62 million while exports to member-countries of European Union were worth $540.39 million. This aggregated to total trade of $970.00 million and a trade surplus of $110.77 million for the Philippines.
Notes:
1/ - includes China, Hong Kong, Japan, Macau, Mongolia, N, Korea, S. Korea, Taiwan
2/ - includes Brunei Darusalam, Cambodia, Indonesia, Laos, Malaysia, Myanmar, Singapore, Thailand, Vietnam
3/ - includes Austria, Belgium, Bulgaria, Cyprus, Czech Republic, Denmark, Estonia, Finland, France, Germany, Greece, Hungary, Ireland, Italy, Latvia, Lithuania, Malta, Netherlands, Poland, Portugal, Romania, Slovakia, Slovenia, Spain, Sweden, Latvia, and UK Great Britain & N. Ireland
Technical Notes:
1. Adjustments on electronic import statistics are based on the transactions that pass through the Electronic to Mobile (e2m) of the Bureau of Customs (BOC).
2. Starting with the January 2007 Press Release, analysis and tables are based on the 2004 Philippine Standard Commodity Classification (PSCC) groupings. This is in compliance with NSCB Resolution No. 03, Series of 2005 entitled “Approving and Adopting the 2004 Philippine Standard Commodity Classification” by all concerned government agencies and instrumentalities.
(Sgd.) CARMELITA N. ERICTA
Administrator
Source: Foreign Trade Statistics Section
Industry and Trade Statistics Department
National Statistics Office
Manila, Philippines