
EXTERNAL TRADE PERFORMANCE
May 2012
(Preliminary)

p-preliminary
r-revised


MAY 2012 TOTAL TRADE STANDS AT $10.318 BILLION
Total external trade in goods for May 2012 reached $10.318 billion, representing a 14.5 percent increase from $9.011 billion recorded during the same month in 2011. This was due to the 10.1 percent increase in total imports to $5.386 billion from $4.893 billion in May 2011. Similarly, exports increased by 19.7 percent to $4.932 billion from $4.119 billion in the same month a year ago. Thus, the balance of trade in goods (BOT-G) for the Philippines in May 2012 registered a deficit of $454 million from $774 million deficit in the same period last year.
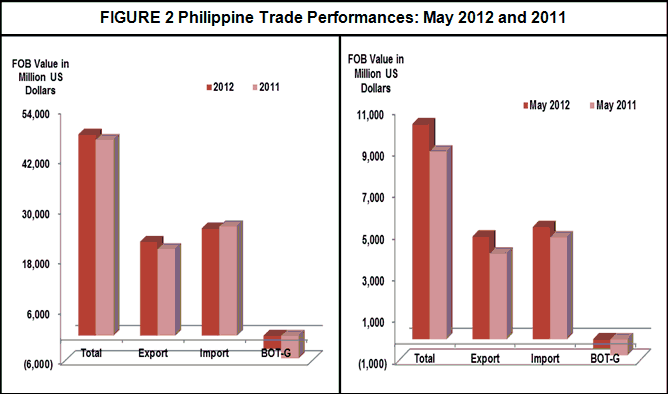
MAY 2012 IMPORTS UP BY10.1 PERC
The country’s total merchandise imports for May 2012 went up by 10.1 percent to $5.386 billion from $4.893 billion. Similarly, it increased by 12.8 percent compared to previous month’s level to $4.773 billion. On the other hand, aggregate imports went down by 1.9 percent from $26.150 billion value in the first five-month period in 2011 to $25.660 billion for the same period in 2012.
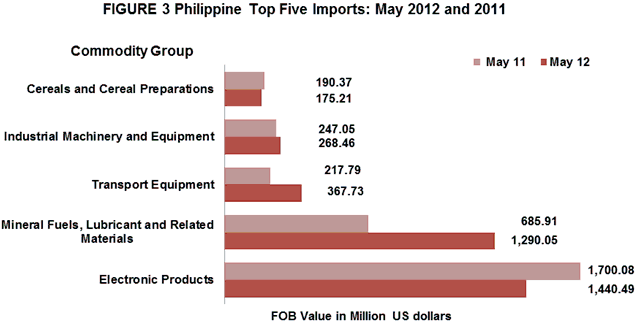
ELECTRONIC PRODUCTS ACCOUNT FOR 26.7 PERCENT OF IMPORT BILL
Accounting for 26.7 percent of the aggregate import bill, payments for Electronic Products (including consigned and direct importation using the expanded coverage of electronic products) went down by 15.3 percent from reported value of $1.700 billion in May 2011 to $1.440 billion in May 2012. However, it increased by 9.3 percent from $1.318 billion recorded in April 2012. Among the major groups of electronic products, Components/Devices (Semiconductors) having the biggest share of 20.4 percent decreased by 22.6 percent from $1.422 billion to $1.101 billion.
Import bill payments for Mineral Fuels, Lubricants and Related Materials ranked second among the top ten imports with 24.0 percent share to total imports. It posted the highest annual growth rate of 88.1 percent among the top ten imports to $1.290 billion from $685.91 million in May 2011.
Transport Equipment was the PH’s third top import for the month with 6.8 percent share to total imports valued at $367.73 million. This figure was up by 68.8 percent from previous year’s level of $217.79 million.
Industrial Machinery and Equipment contributing about 5.0 percent to the total import bill was the fourth top import for the month amounting to $268.46 million. Compared to last year’s amount of $247.05 million, it grew by 8.7 percent.
Fifth in rank and with 3.3 percent share to the total imports was Cereals and Cereal Preparations, recorded $175.21 million worth of imports, lower by 8.0 percent from its year ago level of $190.37 million.
Rounding up the list of the top ten imports for May 2012 were Plastics in Primary and Non-Primary Forms, $144.36 million; Organic and Inorganic Chemicals, $135.39 million; Iron and Steel, $116.78 million; Telecommunication Equipment and Electrical Machinery, $104.28 million; and Medicinal and Pharmaceutical Products, $83.48 million.
Aggregate payment for the country’s top ten imports for May 2012 reached $4.126 billion or 76.6 percent of the total import bill.
RAW MATERIALS AND INTERMEDIATE GOODS ACCOUNT FOR 36.4 PERCENT OF THE TOTAL IMPORTS
Accounting for 36.4 percent of the total imports, payments in May 2012 for Raw Materials and Intermediate Goods amounted to $1.960 billion or 15.4 percent decrement over last year's figure of $2.317 billion. Compared to the previous month’s level, purchases went up by 2.7 percent from $1.909 billion. Semi-Processed Raw Materials had the biggest share of 32.2 percent and valued at $1.736 billion.
Capital Goods, which comprised 26.3 percent of the total imports, went up by 19.9 percent year-on-year to $1.417 billion from $1.182 billion.
Purchases of Consumer Goods amounted to $660.44 million or a positive growth of 1.5 percent from $650.53 million in May 2011.
Imports of commodities under Special Transactions inched up by 1.0 percent to $58.03 million from $57.45 million in same month last year.

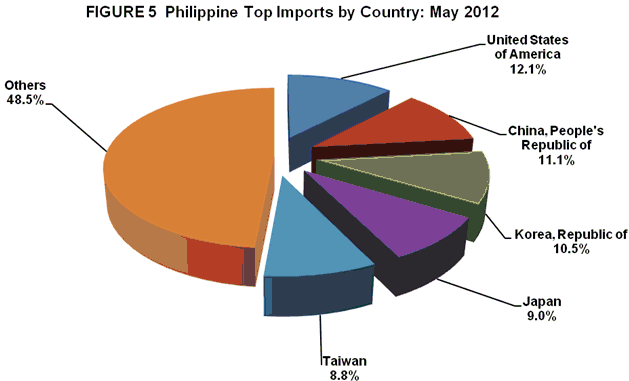
IMPORTS FROM UNITED STATES OF AMERICA ACCOUNT FOR 12.1 PERCENT
United States of America (USA) including Alaska and Hawaii was the country’s biggest source of imports in May 2012 with 12.1 percent share. Payments were recorded at $652.26 million, a decrease of 1.1 percent from $659.83 million in May 2011. Revenue from PH’s exports to USA, on the other hand, reached $714.11 million, generating a total trade value of $1.366 billion and $61.84 million trade surplus for the Philippines.
People’s Republic of China was the second top sources of imports with 11.1 percent share to the total import bill amounting to $597.07 million, higher by 14.9 percent from $519.52 million in May 2011. Exports to People’s Republic of China amounted to $560.64 million, yielding a two-way trade value of $1.158 billion and a trade deficit for PH of $36.43 million.
Republic of Korea came third, accounting for 10.5 percent share of the total import bill in May 2012 with positive growth of 58.8 percent to $565.96 million from $356.31 million. Exports to Republic of Korea amounted to $142.29 million resulting to a total trade value of $708.25 million and a trade deficit of $423.67 million.
Japan including Okinawa ranked fourth among the top sources of imports for the country accounting for 9.0 percent share of the total import bill in May 2012. It was up by 1.8 percent to $484.39 million from $475.98 million. On the other hand, exports to Japan amounted to $1.133 billion resulting to a total trade value of $1.618 billion and a trade surplus of $648.78 million.
Fifth in rank was Taiwan, representing 8.8 percent of the total import bill in May 2012 or an increase of 37.2 percent to $476.61 million from $347.27 million in the same month last year. Exports to Taiwan amounted to $140.27 million resulting to a total trade value of $616.88 million and a trade deficit of $336.34 million.
Other major sources of imports for the month of May 2012 were Singapore, $426.78 million; Thailand, $331.23 million; Malaysia, $315.65 million; Saudi Arabia, $246.29 million; and Indonesia $194.87 million.
Payments for imports from the top ten sources for May 2012 amounted to $4.291 billion or 79.7 percent of the total.
IMPORTS FROM EAST
Philippines’ total imports in May 2012 from East Asia (China, Hong Kong, Japan, Macau, Mongolia, North Korea, South Korea and Taiwan) accounted for 41.8 percent of the county’s total imports with total payments of $2.250 billion or a positive annual growth of 24.6 percent from May 2011 level of $1.806 billion. Total exports to member-countries of East Asia were valued at $2.326 billion, resulting to a total trade of $4.576 billion and a balance of trade in goods (BOT-G) surplus of $75.82 million.
Imports from ASEAN member-countries recorded at $1.348 billion, contributed a 25.0 percent share to total imports. It grew by 3.8 percent compared from $1.299 billion value in May 2011. On the other hand, exports to ASEAN member-countries worth $1.111 billion resulted to a total trade of $2.459 billion and a trade deficit of $236.66 million.
May 2012 imports from European Union were valued at $361.71 million while exports to member-countries of European Union were worth $481.31 million. These aggregated to a total trade value of $843.02 million and a trade surplus of $119.61 million.

Notes:
1/ - includes China, Hong Kong, Japan, Macau, Mongolia, N, Korea, S. Korea, Taiwan
2/ - includes Brunei Darussalam, Cambodia, Indonesia, Laos, Malaysia, Myanmar, Singapore, Thailand, Vietnam
3/ - includes Alaska and Hawaii
4/ - includes Austria, Belgium, Bulgaria, Cyprus, Czech Republic, Denmark, Estonia, Finland, France, Germany, Greece, Hungary, Ireland, Italy, Latvia, Lithuania, Luxembourg, Malta, Netherlands, Poland, Portugal, Romania, Slovakia, Slovenia, Spain, Sweden and UK Great Britain
Technical Notes:
- Adjustments on electronic import statistics are based on the transactions that pass through the Electronic to Mobile (e2m) of the Bureau of Customs (BOC).
- Starting with the 2007 Press Release, analysis and tables are based on the 2004 Philippine Standard Commodity Classification (PSCC) groupings. This is in compliance with NSCB Resolution No. 03, Series of 2005 entitled “Approving and Adopting the 2004 Philippine Standard Commodity Classification” by all concerned government agencies and instrumentalities.
CARMELITA N. ERICTA
Administrator
| Attachment | Size |
|---|---|
|
|
25.94 KB |
|
|
25.03 KB |
|
|
28.34 KB |
|
|
29.54 KB |
|
|
31.68 KB |
|
|
41.88 KB |
|
|
39.25 KB |
|
|
28.69 KB |
|
|
27.75 KB |