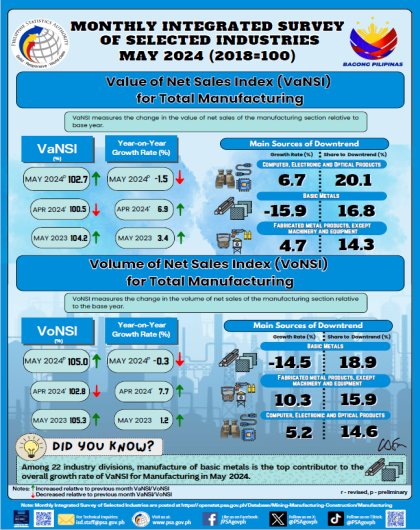
Production Index and Net Sales Index (Monthly Integrated Survey of Selected Industries) May 2024 (2018=100)
Release Date:
Production Index and Net Sales Index (Monthly Integrated Survey of Selected Industries) April 2024 (2018=100)
Release Date:
Production Index and Net Sales Index (Monthly Integrated Survey of Selected Industries) March 2024 (2018=100)
Release Date:
Production Index and Net Sales Index (Monthly Integrated Survey of Selected Industries) February 2024 (2018=100)
Release Date:
Production Index and Net Sales Index (Monthly Integrated Survey of Selected Industries) January 2024 (2018=100)
Release Date:
Production Index and Net Sales Index (Monthly Integrated Survey of Selected Industries) December 2023 (2018=100)
Release Date:
| Attachment |
Size |
 Table 1. Value of Production Index (2018=100), Year-on-Year Growth Rates for Manufacturing Section: January 2022 – December 202 Table 1. Value of Production Index (2018=100), Year-on-Year Growth Rates for Manufacturing Section: January 2022 – December 202 |
45.87 KB |
|
Table 1a. Value of Production Index (2018=100), Year-on-Year Growth Rates for Manufacture of Food Products: January 2022 – Dec |
24.97 KB |
|
Table 2. Volume of Production Index (2018=100), Year-on-Year Growth Rates for Manufacturing Section: January 2022 – December 20 |
46.6 KB |
|
Table 2a. Volume of Production Index (2018=100), Year-on-Year Growth Rates for Manufacture of Food Products: January 2022 – De |
25.31 KB |
|
Table 3. Value of Net Sales Index (2018=100), Year-on-Year Growth Rates for Manufacturing Section: January 2022 – December 2023 |
49.54 KB |
|
Table 3a. Value of Net Sales Index (2018=100), Year-on-Year Growth Rates for Manufacture of Food Products: January 2022 – Decem |
27.76 KB |
|
Table 4. Volume of Net Sales Index (2018=100), Year-on-Year Growth Rates for Manufacturing Section: January 2022 – December 202 |
49.72 KB |
|
Table 4a. Volume of Net Sales Index (2018=100), Year-on-Year Growth Rates for Manufacture of Food Products: January 2022 – Dec |
27.33 KB |
|
Table 5. Producer Price Index (2018=100), Year-on-Year Growth Rates for Manufacturing Section January 2022 – December 2023p |
49.1 KB |
|
Table 6. Average Capacity Utilization Rate by Major Industry Division: MISSI, December 2022 - December 2023p |
17.45 KB |
|
Table 7. Distribution of Samples and Responding Establishments by Industry Division: MISSI November 2023p, November 2023r, and D |
15.27 KB |
|
Table 8. Distribution of Samples and Responding Establishments by Industry Division: PPS November 2023p, November 2023r and Dece |
15.56 KB |
 Press Release Press Release |
535.47 KB |
Production Index and Net Sales Index (Monthly Integrated Survey of Selected Industries) November 2023 (2018=100)
Release Date:
| Attachment |
Size |
|
Table 1. Value of Production Index (2018=100), Year-on-Year Growth Rates for Manufacturing Section: January 2022 – November 202 |
45.24 KB |
|
Table 1a. Value of Production Index (2018=100), Year-on-Year Growth Rates for Manufacture of Food Products: January 2022 – Nov |
25.19 KB |
|
Table 2. Volume of Production Index (2018=100), Year-on-Year Growth Rates for Manufacturing Section: January 2022 – November 20 |
45.8 KB |
|
Table 2a. Volume of Production Index (2018=100), Year-on-Year Growth Rates for Manufacture of Food Products: January 2022 – No |
25.57 KB |
|
Table 3. Value of Net Sales Index (2018=100), Year-on-Year Growth Rates for Manufacturing Section: January 2022 – November 2023 |
46.66 KB |
|
Table 3a. Value of Net Sales Index (2018=100), Year-on-Year Growth Rates for Manufacture of Food Products: January 2022 – Novem |
26.69 KB |
|
Table 4. Volume of Net Sales Index (2018=100), Year-on-Year Growth Rates for Manufacturing Section: January 2022 – November 202 |
48.13 KB |
|
Table 4a. Volume of Net Sales Index (2018=100), Year-on-Year Growth Rates for Manufacture of Food Products: January 2022 – Nov |
26.32 KB |
|
Table 5. Producer Price Index (2018=100), Year-on-Year Growth Rates for Manufacturing Section January 2022 – November 2023p |
48.93 KB |
|
Table 6. Average Capacity Utilization Rate by Major Industry Division: MISSI, November 2022 - November 2023p |
18.33 KB |
|
Table 7. Distribution of Samples and Responding Establishments by Industry Division: MISSI October 2023p, October 2023r, and Nov |
16.13 KB |
|
Table 8. Distribution of Samples and Responding Establishments by Industry Division: PPS October 2023p, October 2023r and Novem |
15.95 KB |
|
PR for MISSI November 2023_signed |
515.13 KB |
Production Index and Net Sales Index (Monthly Integrated Survey of Selected Industries) October 2023 (2018=100)
Release Date:
| Attachment |
Size |
|
Table 1. Value of Production Index (2018=100), Year-on-Year Growth Rates for Manufacturing Section: January 2022 – October 2023 |
44.34 KB |
|
Table 1a. Value of Production Index (2018=100), Year-on-Year Growth Rates for Manufacture of Food Products: January 2022 – Oct |
24.57 KB |
|
Table 2. Volume of Production Index (2018=100), Year-on-Year Growth Rates for Manufacturing Section: January 2022 – October 202 |
44.91 KB |
|
Table 2a. Volume of Production Index (2018=100), Year-on-Year Growth Rates for Manufacture of Food Products: January 2022 – Oc |
24.94 KB |
|
Table 3. Value of Net Sales Index (2018=100), Year-on-Year Growth Rates for Manufacturing Section: January 2022 – October 2023p |
46.09 KB |
|
Table 3a. Value of Net Sales Index (2018=100), Year-on-Year Growth Rates for Manufacture of Food Products: January 2022 – Octob |
26.46 KB |
|
Table 4. Volume of Net Sales Index (2018=100), Year-on-Year Growth Rates for Manufacturing Section: January 2022 – October 2023 |
47.18 KB |
|
Table 4a. Volume of Net Sales Index (2018=100), Year-on-Year Growth Rates for Manufacture of Food Products: January 2022 – Oct |
26.11 KB |
|
Table 5. Producer Price Index (2018=100), Year-on-Year Growth Rates for Manufacturing Section January 2022 – October 2023p |
46.81 KB |
|
Table 6. Average Capacity Utilization Rate by Major Industry Division: MISSI, October 2022 - October 2023p |
17.48 KB |
|
Table 7. Distribution of Samples and Responding Establishments by Industry Division: MISSI September 2023p, September 2023r, and |
15.15 KB |
|
Table 8. Distribution of Samples and Responding Establishments by Industry Division: PPS September 2023p, September 2023r and Oc |
15.49 KB |
|
Press Release |
515.06 KB |
Production Index and Net Sales Index (Monthly Integrated Survey of Selected Industries) September 2023 (2018=100)
Release Date:
| Attachment |
Size |
|
Table 1. Value of Production Index (2018=100), Year-on-Year Growth Rates for Manufacturing Section: January 2022 – September 20 |
43.27 KB |
|
Table 1a. Value of Production Index (2018=100), Year-on-Year Growth Rates for Manufacture of Food Products: January 2022 – Sep |
24.49 KB |
|
Table 2. Volume of Production Index (2018=100), Year-on-Year Growth Rates for Manufacturing Section: January 2022 – September 2 |
43.82 KB |
|
Table 2a. Volume of Production Index (2018=100), Year-on-Year Growth Rates for Manufacture of Food Products: January 2022 – Se |
24.17 KB |
|
Table 3. Value of Net Sales Index (2018=100), Year-on-Year Growth Rates for Manufacturing Section: January 2022 – September 202 |
45.66 KB |
|
Table 3a. Value of Net Sales Index (2018=100), Year-on-Year Growth Rates for Manufacture of Food Products: January 2022 – Septe |
25.94 KB |
|
Table 4. Volume of Net Sales Index (2018=100), Year-on-Year Growth Rates for Manufacturing Section: January 2022 – September 20 |
46.69 KB |
|
Table 4a. Volume of Net Sales Index (2018=100), Year-on-Year Growth Rates for Manufacture of Food Products: January 2022 – Sep |
26.35 KB |
|
Table 5. Producer Price Index (2018=100), Year-on-Year Growth Rates for Manufacturing Section January 2022 – September 2023p |
45.79 KB |
|
Table 6. Average Capacity Utilization Rate by Major Industry Division: MISSI, September 2022 - September 2023p |
17.58 KB |
|
Table 7. Distribution of Samples and Responding Establishments by Industry Division: MISSI August 2023p, August 2023r, and Septe |
15.31 KB |
|
Table 8. Distribution of Samples and Responding Establishments by Industry Division: PPS August 2023p, August 2023r and Septembe |
15.6 KB |
|
PR for MISSI September 2023_signed |
512.86 KB |
Production Index and Net Sales Index (Monthly Integrated Survey of Selected Industries) August 2023 (2018=100)
Release Date:
| Attachment |
Size |
|
Table 1. Value of Production Index (2018=100), Year-on-Year Growth Rates for Manufacturing Section: January 2022 – August 2023p |
43.23 KB |
|
Table 1a. Value of Production Index (2018=100), Year-on-Year Growth Rates for Manufacture of Food Products: January 2022 – Aug |
24.17 KB |
|
Table 2. Volume of Production Index (2018=100), Year-on-Year Growth Rates for Manufacturing Section: January 2022 – August 2023 |
43.81 KB |
|
Table 2a. Volume of Production Index (2018=100), Year-on-Year Growth Rates for Manufacture of Food Products: January 2022 – Au |
24.45 KB |
|
Table 3. Value of Net Sales Index (2018=100), Year-on-Year Growth Rates for Manufacturing Section: January 2022 – August 2023p |
44.41 KB |
|
Table 3a. Value of Net Sales Index (2018=100), Year-on-Year Growth Rates for Manufacture of Food Products: January 2022 – Augus |
25.62 KB |
|
Table 4. Volume of Net Sales Index (2018=100), Year-on-Year Growth Rates for Manufacturing Section: January 2022 – August 2023p |
45.98 KB |
|
Table 4a. Volume of Net Sales Index (2018=100), Year-on-Year Growth Rates for Manufacture of Food Products: January 2022 – Aug |
25.52 KB |
|
Table 5. Producer Price Index (2018=100), Year-on-Year Growth Rates for Manufacturing Section January 2022 – August 2023p |
45.25 KB |
|
Table 6. Average Capacity Utilization Rate by Major Industry Division: MISSI, August 2022 - August 2023p |
17.34 KB |
|
able 7. Distribution of Samples and Responding Establishments by Industry Division: MISSI July 2023p, July 2023r, and August 202 |
17.71 KB |
|
Table 8. Distribution of Samples and Responding Establishments by Industry Division: PPS July 2023p, July 2023r and August 2023p |
15.52 KB |
|
PR for MISSI August 2023_signed |
512.96 KB |